Salut,
J'ai modifié le fichier "month.xsl" pour y ajouter des graphiques comme dans "year.xsl".
Mon problème est que GW ne générère pas ces graphiques.
Est ce normal ?
Voici un extrait de mes modifs (j'ai évidement crée le fichier "graph-month-3.xml" associé dans le répertoire "Statistics"), si je mets un graphique avec le mon "graph-month-3.png" dans le répertoire "Statistics/2008/08" (par exemple) il apparait où il faut :
<table width="100%">
<tr>
<td></td>
<td class="stats-item">Max</td>
<td class="stats-item">Moyenne</td>
</tr>
<tr>
<td class="stats-item-col">Radiation solaire</td>
<td class="stats-cell">
<xsl:value-of select="solar_radiation/max"/> W/m²
<div class="stats-date">
<xsl:value-of select="solar_radiation/max-date-text"/>
</div>
</td>
<td class="stats-cell">
<xsl:value-of select="solar_radiation/mean"/> W/m²
</td>
</tr>
<tr>
<td class="stats-item-col">Index UV</td>
<td class="stats-cell">
<xsl:value-of select="uv_index/max"/>
<div class="stats-date">
<xsl:value-of select="uv_index/max-date-text"/>
</div>
</td>
<td class="stats-cell">
<xsl:value-of select="uv_index/mean"/>
</td>
</tr>
</table>
<br/><Center>
<img>
<xsl:attribute name="src">
../../<xsl:value-of select="@year"/>/<xsl:value-of select="@month"/>/graph-month-3.png
</xsl:attribute>
</img></Center>
<br/>
Modifications "month.xsl"
Modifications "month.xsl"
Ma station => http://www.meteo-boisney.fr

--- Station Vantage Pro 2 - Plugin VantagePro.dll ---
--- GraphWeather Version 2.0.312b ---
--- Station Vantage Pro 2 - Plugin VantagePro.dll ---
--- GraphWeather Version 2.0.312b ---
-
TiToine

- Site Admin
- Messages : 3356
- Inscription : lun. mars 20, 2006 11:16 am
- Localisation : Montréal
- Contact :
Re: Modifications "month.xsl"
Ca donne quoi si tu charges ton graph-month-3.xml dans GW?
Re: Modifications "month.xsl"
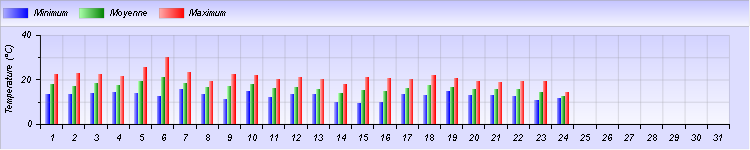
Ca me donne le graphique attendu, c'est à dire ça :

Par contre, je viens de me rendre compte que je ne pouvais le calculer que pour Août, si je sélectionne la période Juillet dans GW, ça ne marche pas !?!
Voici le fichier graph-month-3.xml :
<?xml version="1.0" encoding="iso-8859-1" ?>
<stylesheet>
<image width="500" height="150" />
<frame width="500" height="150" position-x="0" position-y="0" shadow="0">
<title text="" alignement="3" angle="0">
<font color="FF000000" facename="Arial" size="14" weight="400" italic="0" />
</title>
<background color1="FFDDDDFF" color2="FFFFFFFF" gradient="0" gradient-direction="135" stretch="1" />
<border cornerradius="0" color="55555555" thick="1" />
</frame>
<!-- ================= First Lineplot ================= -->
<bargraph width="500" height="120" shadow="0" position-x="0" position-y="35" margin-top="0" margin-right="20" margin-bottom="30" margin-left="40">
<xaxis color="FF000000" grid="1" autoscale="1" min="0" max="0">
<labels labelinterval="1" angle="0" side="left" hide="0">
<font color="FF000000" facename="Arial" size="12" weight="400" italic="1" />
</labels>
<ticks majorticks="7" minorticks="4" side="bottom" hidefirst="0" hidelast="0" hideminorticks="0" hide="0" />
</xaxis>
<y1axis color="FF000000" grid="1" autoscale="1" min="0" max="0" y-base="0.0" titleside="left" titlemargin="25">
<title text="Energie Solaire (W/m²)" alignement="vcenter|hcenter" angle="0">
<font color="FF000000" facename="Arial" size="12" weight="400" italic="1" />
</title>
<labels labelinterval="1" angle="0" format=".0" side="left" hide="0" >
<font color="FF000000" facename="Arial" size="12" weight="400" italic="1" />
</labels>
<ticks majorticks="5" minorticks="0" side="left" hidefirst="0" hidelast="0" hideminorticks="0" hide="0" />
</y1axis>
<data>
<stats_month_truemean_solar_radiation axisbind="y1axis" legend="Energie Solaire" color1="FFFFFF00" color2="FFFF0000" gradient="horizontal" antialiasing="1" filled="1" />
</data>
<legend orientation="0" margin="3" width="500" position-x="0" position-y="0" hide="0" shadow="0">
<font color="FF000000" facename="Arial" size="12" weight="400" italic="1" />
<border cornerradius="0" color="55555555" thick="1" />
<background color1="FFBBBBFF" color2="FFFFFFFF" gradient="1" gradient-direction="90"/>
</legend>
<graphbackground color1="FFCCCCFF" color2="FFFFFFFF" gradient="1" gradient-direction="90" />
</bargraph>
</stylesheet>
J'ai fait d'autres fichiers sur le même modèle pour les T° et la pluie, et c'est la même chose...
Comme tu vois, je suis toujours sur le brèche pour tester des trucs
Ma station => http://www.meteo-boisney.fr
--- Station Vantage Pro 2 - Plugin VantagePro.dll ---
--- GraphWeather Version 2.0.312b ---
--- Station Vantage Pro 2 - Plugin VantagePro.dll ---
--- GraphWeather Version 2.0.312b ---
-
TiToine
- Site Admin
- Messages : 3356
- Inscription : lun. mars 20, 2006 11:16 am
- Localisation : Montréal
- Contact :
Re: Modifications "month.xsl"
Est-ce que graph-month-1.xml et graph-month-2.xml existent?
Re: Modifications "month.xsl"
Oui.
graph-month-1 : pour les températures sur le modèle de graph-year-1
graph-month-2 : pour la pluie sur le modèle de graph-year-2
edit : mais j'ai peut être mal compris ta question.
Aucun des trois graphiques n'est créé par GW dans les répertoires "Statistics/2008/08" ou "Statistics/2008/07" quand je régénère ou mets à jour la base de donées statistiques
Ma station => http://www.meteo-boisney.fr
--- Station Vantage Pro 2 - Plugin VantagePro.dll ---
--- GraphWeather Version 2.0.312b ---
--- Station Vantage Pro 2 - Plugin VantagePro.dll ---
--- GraphWeather Version 2.0.312b ---
-
TiToine
- Site Admin
- Messages : 3356
- Inscription : lun. mars 20, 2006 11:16 am
- Localisation : Montréal
- Contact :
Re: Modifications "month.xsl"
Un ptit bug, c'est corrigé pour la prochaine version.
-
MAGNUS

- Membre
- Messages : 992
- Inscription : dim. mars 26, 2006 4:44 pm
- Localisation : VIDAUBAN (83) FRANCE
- Contact :
Re: Modifications "month.xsl"
Bonjour à tous,Pidou a écrit :Ca me donne le graphique attendu, c'est à dire ça :
Par contre, je viens de me rendre compte que je ne pouvais le calculer que pour Août, si je sélectionne la période Juillet dans GW, ça ne marche pas !?!
J'ai fait d'autres fichiers sur le même modèle pour les T° et la pluie, et c'est la même chose...
Comme tu vois, je suis toujours sur le brèche pour tester des trucs
Moi aussi j'ai modifié les graph en question et ils ne fonctionnent effectivement que pour le mois et l'année en cours.
Pourrait-on faire en sorte que l'on puisse modifier les période comme on le fait avec les graph dans stylesheets
Cordialement.
Station WMR 200 avec XNet_meteo V 2014-10-29a Logiciels:Graphweather V 3.0.16, Noaa Template2, Windows 7
Mon abri météo ici :http://www.vardecouverte.fr/sta%20bc2008.htm
Site Web : http://www.vardecouverte.fr
Mon abri météo ici :http://www.vardecouverte.fr/sta%20bc2008.htm
Site Web : http://www.vardecouverte.fr
Re: Modifications "month.xsl"
Merci Antoine.TiToine a écrit :Un ptit bug, c'est corrigé pour la prochaine version.
Ma station => http://www.meteo-boisney.fr
--- Station Vantage Pro 2 - Plugin VantagePro.dll ---
--- GraphWeather Version 2.0.312b ---
--- Station Vantage Pro 2 - Plugin VantagePro.dll ---
--- GraphWeather Version 2.0.312b ---
Re: Modifications "month.xsl"
Salut Antoine,
Bravo pour toutes les mises à jour dans la nouvelle version.
Mais je n'arrive toujours pas à faire fonctionner les graphiques pour les stats mensuelles...
- Un graphique est bien créé pour les mois précédents (ce qui n'était pas le cas avant).
- Mais les graphiques créés ne sont pas bons, alors que si je les exécutes dans GW directement ça marche très bien pour le mois en cours (impossible néanmoins de générer les graphiques dans GW pour les mois passés).
Pour voir la différence, il suffit de comparer le graph suivant avec ce qui est généré sur mon site pour Août 2008 par exemple :
Ma station => http://www.meteo-boisney.fr
--- Station Vantage Pro 2 - Plugin VantagePro.dll ---
--- GraphWeather Version 2.0.312b ---
--- Station Vantage Pro 2 - Plugin VantagePro.dll ---
--- GraphWeather Version 2.0.312b ---
-
TiToine
- Site Admin
- Messages : 3356
- Inscription : lun. mars 20, 2006 11:16 am
- Localisation : Montréal
- Contact :
Re: Modifications "month.xsl"
Je vais regarder ca...il me semble que ca fonctionnait chez moi.
Re: Modifications "month.xsl"
Merci.
Je peux poster les scripts month.xls et graph-month-1.xml, graph-month-2.xml et graph-month-3.xml que j'utilise si nécessaire.
Je peux poster les scripts month.xls et graph-month-1.xml, graph-month-2.xml et graph-month-3.xml que j'utilise si nécessaire.
Ma station => http://www.meteo-boisney.fr
--- Station Vantage Pro 2 - Plugin VantagePro.dll ---
--- GraphWeather Version 2.0.312b ---
--- Station Vantage Pro 2 - Plugin VantagePro.dll ---
--- GraphWeather Version 2.0.312b ---
-
COULET

- Membre
- Messages : 805
- Inscription : sam. mai 13, 2006 5:04 pm
- Localisation : MONTPELLIER
- Contact :
Re: Modifications "month.xsl"
Salut à tous !
Pour moi non plus toujours pas de graphe mensuel !
Merci encore pour tout !
A+
Pour moi non plus toujours pas de graphe mensuel !
Merci encore pour tout !
A+
P COULET 
Vantage Vue - GW 3.0.15 - Windows 10 - Cumulus
Vantage Vue - GW 3.0.15 - Windows 10 - Cumulus
Re: Modifications "month.xsl"
Salut Antoine,
As tu pu trouver le bug pour les graphiques mensuels dans les statistiques ou as tu besoin de mes scripts pour tester ?
As tu pu trouver le bug pour les graphiques mensuels dans les statistiques ou as tu besoin de mes scripts pour tester ?
Ma station => http://www.meteo-boisney.fr
--- Station Vantage Pro 2 - Plugin VantagePro.dll ---
--- GraphWeather Version 2.0.312b ---
--- Station Vantage Pro 2 - Plugin VantagePro.dll ---
--- GraphWeather Version 2.0.312b ---
-
TiToine
- Site Admin
- Messages : 3356
- Inscription : lun. mars 20, 2006 11:16 am
- Localisation : Montréal
- Contact :
Re: Modifications "month.xsl"
Oui c'est trouvé et corrigé.
On peut tracer dans GW les stats pour n'importe quelle année. Par exemple:
stats_year_min_outdoor_temperature donne le graph des min de l'année en cours
stats_2007_min_outdoor_temperature donne le graph des min de l'année 2007
stats_200708_min_outdoor_temperature donne le graph des min d'aout 2007
On peut tracer dans GW les stats pour n'importe quelle année. Par exemple:
stats_year_min_outdoor_temperature donne le graph des min de l'année en cours
stats_2007_min_outdoor_temperature donne le graph des min de l'année 2007
stats_200708_min_outdoor_temperature donne le graph des min d'aout 2007