Bonjour,
J'ai cherché sur le forum, mais pas trouvé ce que je veux.
J'ai trouvé pour quantité pluie par mois (ça c'est fait) , mais ce que je voudrais c'est afficher un graph avec le nombre de jour de pluie par mois.
jan. fév. mars avr. mai etc....Si vous avez la réponse merci d'avance
Bonne soirée
Pierre
(Résolu) nombre jour pluie par mois
-
Pierre50500
- Membre
- Messages : 31
- Inscription : lun. janv. 12, 2015 6:39 pm
- Localisation : Carentan
- Contact :
(Résolu) nombre jour pluie par mois
Dernière modification par Pierre50500 le lun. févr. 16, 2015 6:21 pm, modifié 1 fois.
Station Orégon scientifique WMR 200 complète avec Sonde UV installée le 25/12/2014.
Logiciels: Graphweather 3.0.15, Xnet météo 2014-10-29a, et site météo villarzel.
Windows 7 64 bits
PC: HP G72 4 Go ram
Site: http://meteo50500.free.fr/]
Logiciels: Graphweather 3.0.15, Xnet météo 2014-10-29a, et site météo villarzel.
Windows 7 64 bits
PC: HP G72 4 Go ram
Site: http://meteo50500.free.fr/]
-
paaubert

- Membre
- Messages : 2624
- Inscription : dim. janv. 17, 2010 7:16 pm
- Localisation : 1555 Villarzel - Switzerland
- Contact :
Re: nombre jour pluie par mois
Salut Pierre,
il y a une balise pour ça :
NbDaysOfRainfall
la listes des balises est ici
http://www.aguilmard.com/phpBB3/viewtopic.php?f=2&t=618
Bonne soirée
il y a une balise pour ça :
NbDaysOfRainfall
la listes des balises est ici
http://www.aguilmard.com/phpBB3/viewtopic.php?f=2&t=618
Bonne soirée
_________________________________________________________________________________________________________
Station Vantage Pro2+ avec station agricole - Weatherlink 6.0.3 - GraphWeather 3.0.15b - Cumulus 1.9.4 - Windows W10 ultimate x64
http://www.boock.ch/meteo-villarzel.php

Station Vantage Pro2+ avec station agricole - Weatherlink 6.0.3 - GraphWeather 3.0.15b - Cumulus 1.9.4 - Windows W10 ultimate x64
http://www.boock.ch/meteo-villarzel.php
-
Pierre50500
- Membre
- Messages : 31
- Inscription : lun. janv. 12, 2015 6:39 pm
- Localisation : Carentan
- Contact :
Re: nombre jour pluie par mois
Salut Pierre-André
Oui je sais, voila ce que j'écris et je n'y arrive pas, c'est dans mon site que je voudrais afficher le nombre de jour de pluie par mois sur un graph.
<!-- ================= Pluie jours par mois================= -->
<bargraph width="900" height="300" shadow="0" position-x="10" position-y="650" margin-top="40" margin-right="70" margin-bottom="50" margin-left="65">
<xaxis color="FF0000FF" grid="1" autoscale="0" min="0" max="0">
<labels labelinterval="1" labels="Janv.;Fév.;Mars;Avril;Mai;Juin;Juil.;Août;Sep.;Oct.;Nov.;Déc." angle="0" side="left" hide="0">
<font color="FF0000FF" facename="Arial" size="12" weight="400" italic="1" />
</labels>
<ticks majorticks="7" minorticks="4" side="bottom" hidefirst="0" hidelast="0" hideminorticks="0" hide="0" />
</xaxis>
<y1axis color="FF0000FF" grid="1" autoscale="1" min="0" max="0" titleside="top" titlemargin="35">
<title text="Précipitations ( $Unit[Rainfall] )" alignement="vcenter|hcenter" angle="0">
<font color="FF0000FF" facename="Arial" size="20" weight="400" italic="1" />
</title>
<labels labelinterval="1" angle="0" format=".0" side="left" hide="0" >
<font color="FF0000FF" facename="Arial" size="12" weight="400" italic="1" />
</labels>
<ticks majorticks="2" minorticks="4" side="left" hidefirst="0" hidelast="0" hideminorticks="0" hide="0" />
</y1axis>
<data>
<Stats[Year_NbDaysOfRainfall,.0] axisbind="y1axis" legend="Nombre de jours" color1="FFAAAAFF" color2="FF0000FF" antialiasing="1" filled="1" />
</data>
<legend orientation="0" margin="5" width="765" position-x="75" position-y="650" hide="0" shadow="0">
<font color="FF0000FF" facename="Arial" size="12" weight="400" italic="1" />
<border cornerradius="0" color="55555555" thick="1" />
<background color1="FFBBBBFF" color2="FFFFFFFF" gradient="1" gradient-direction="90"/>
</legend>
<border cornerradius="0" color="55555555" thick="0" />
<background color1="00000000" stretch="1" />
<graphbackground color1="" color2="" gradient="1" gradient-direction="90" />
</bargraph>
Station Orégon scientifique WMR 200 complète avec Sonde UV installée le 25/12/2014.
Logiciels: Graphweather 3.0.15, Xnet météo 2014-10-29a, et site météo villarzel.
Windows 7 64 bits
PC: HP G72 4 Go ram
Site: http://meteo50500.free.fr/]
Logiciels: Graphweather 3.0.15, Xnet météo 2014-10-29a, et site météo villarzel.
Windows 7 64 bits
PC: HP G72 4 Go ram
Site: http://meteo50500.free.fr/]
Re: nombre jour pluie par mois
Salut pierre....
tu parle d'un graphe pour pluie par mois...
tu parles d'une ligne graphique ou de Bargraph ?
Hier,j'ai installer celui ci sur mon site...me reste juste le changement de couleur a faire
Bon...ca parait vide mais ce soir jvais ajouter les quantitees manuellement vu que mon pluviometre n'est pas modifier encore hehehe.Pour l'instant juste quantitées annuelles
-
Pierre50500
- Membre
- Messages : 31
- Inscription : lun. janv. 12, 2015 6:39 pm
- Localisation : Carentan
- Contact :
Re: nombre jour pluie par mois
Bonsoir,
Je parle de bargraph, comme ton dernier. Mais j'ai trouvé l'instruction, c'est
<stats_year_nbdaysofrainfall
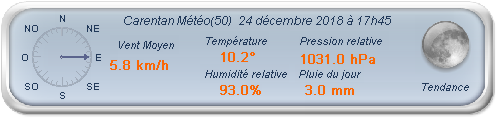
ça donne ça (voir image) c'est ce que je veux, par contre je voudrais aussi mettre les valeurs sur les colonnes et avoir janv. févr. mars avr. etc... au lieu des chiffres, et ça je ne trouve pas.
Amitiés
Pierre
Je parle de bargraph, comme ton dernier. Mais j'ai trouvé l'instruction, c'est
<stats_year_nbdaysofrainfall
ça donne ça (voir image) c'est ce que je veux, par contre je voudrais aussi mettre les valeurs sur les colonnes et avoir janv. févr. mars avr. etc... au lieu des chiffres, et ça je ne trouve pas.
Amitiés
Pierre
Vous ne pouvez pas consulter les pièces jointes insérées à ce message.
Station Orégon scientifique WMR 200 complète avec Sonde UV installée le 25/12/2014.
Logiciels: Graphweather 3.0.15, Xnet météo 2014-10-29a, et site météo villarzel.
Windows 7 64 bits
PC: HP G72 4 Go ram
Site: http://meteo50500.free.fr/]
Logiciels: Graphweather 3.0.15, Xnet météo 2014-10-29a, et site météo villarzel.
Windows 7 64 bits
PC: HP G72 4 Go ram
Site: http://meteo50500.free.fr/]
Re: nombre jour pluie par mois
Si je mettais le code pour la derniere partie avec les chiffres au dessus ,ca t'irais ?....ca pourrais peut etre t'aider...des fois avec 2-3 codes on met le notre a notre gout hehehe
-
Pierre50500
- Membre
- Messages : 31
- Inscription : lun. janv. 12, 2015 6:39 pm
- Localisation : Carentan
- Contact :
Re: nombre jour pluie par mois
sur ça m'interresse.
Station Orégon scientifique WMR 200 complète avec Sonde UV installée le 25/12/2014.
Logiciels: Graphweather 3.0.15, Xnet météo 2014-10-29a, et site météo villarzel.
Windows 7 64 bits
PC: HP G72 4 Go ram
Site: http://meteo50500.free.fr/]
Logiciels: Graphweather 3.0.15, Xnet météo 2014-10-29a, et site météo villarzel.
Windows 7 64 bits
PC: HP G72 4 Go ram
Site: http://meteo50500.free.fr/]
Re: nombre jour pluie par mois
Voila...tout le code au complet
juste a coplier le tout et le coller dans une nouvelle page xml ensuite,tu y vas avec essai et erreur...le plus long a faire hahaha.
je vais regarder dans mes autres stylesheet,j'en ai tellement telecharger que j'ai surement ce qui faut
juste a coplier le tout et le coller dans une nouvelle page xml ensuite,tu y vas avec essai et erreur...le plus long a faire hahaha.
je vais regarder dans mes autres stylesheet,j'en ai tellement telecharger que j'ai surement ce qui faut
Code : Tout sélectionner
<?xml version="1.0" encoding="iso-8859-1" ?>
<stylesheet>
<!-- %%%%%%%%%%%%%%%%%%%%%%%%%%%%%%%%%%%%%%%%%%%%%%%%%%%%%%%%%%%%%%%%%%%%%%% -->
<!-- %% CVT_PRECIPITATIONS_4G %%%%%%%%%%%%%%%%%%%%%%%%%%%%%%%%%%%%%%%%%%%%%% -->
<!-- %% Olivier CHAUVET 2012 %%%%%%%%%%%%%%%%%%%%%%%%%%%%%%%%%%%%%%%%%%%%%%% -->
<!-- %%%%%%%%%%%%%%%%%%%%%%%%%%%%%%%%%%%%%%%%%%%%%%%%%%%%%%%%%%%%%%%%%%%%%%% -->
<!-- == DEFINITION FENETRE ================================================= -->
<!-- == WIDTH   = LARGEUR GLOBALE FENETRE (Pixels) ========================= -->
<!-- == HEIGHT  = HAUTEUR GLOBALE FENETRE (Pixels) ========================= -->
	<image
		width="900"
		height="880" />
<!-- /////////////////////////////////////////////////////////////////////// -->
<!-- == DEFINITION TAILLE AFFICHAGE  ======================================= -->
<!-- == WIDTH      = LARGEUR FENETRE (Pixels) ============================== -->
<!-- == HEIGHT     =  HAUTEUR FENETRE (Pixels) ============================= -->
<!-- == Positionx =  POS HAUTEUR FENETRE (Pixels) PAR RAP FENETRE GLOBALE == -->
<!-- == PositionY =  POS HAUTEUR FENETRE (Pixels) PAR RAP FENETRE GLOBALE == -->
	<frame
		width="900"
		height="880"
		position-x="0"
		position-y="0">
		<background
				color="FF000000"
				texture=""
				tretch= ""/>
			<border
				cornerradius= ""
				color="FFFF0000"
				thick="2"/>
	</frame>
<!-- == GRAPHIQUE_PRECIPITATIONS  =========================================  -->
<!-- == CARACTERISTIQUE CADRE GRAPHIQUE ===================================  -->
<lineplot
	width="875"
	height="210"
	shadow="000"
	position-x="10"
	position-y="5"
	margin-top="20"
	margin-right="20"
	margin-bottom="30"
	margin-left="65">
		<border
		cornerradius="0"
		color="FF0000FF"
		thick="0" />
		<background
			color1="FF000000"
			stretch="1" />
<!-- == AXES ==============================================================  -->
<!-- == GRID=0 Pas Affichage ==============================================  -->
<!-- == GRID=1 Affichage ==================================================  -->
<!-- == AXES X ============================================================  -->
	<xaxis
		color="FFFF0000"
		grid="0"
		autoscale="0"
		min="0"
		max="0">
<!-- == TITRE ECHELLE AXES X ==============================================  -->
	<title
		text=""
		alignement="vcenter|hcenter"
		angle="0">
		<font
			color="FF000000"
			facename="Arial"
			size="12"
			weight="400"
			italic="1" />
	</title>
<!-- == UNITES AXE X ======================================================  -->
<!-- == LABEL=1 on Affiche TOUT ===========================================  -->
<!-- == LABEL=2 On affiche 1 sur 2 ========================================  -->
	<labels
		labelinterval="1"
		angle="0"
		side="left"
		hide="0">
		<font
			color="FFFFFFFF"
			facename="Arial"
			size="12"
			weight="800"
			italic="1" />
	</labels>
<!-- == GRADUATION AXE X ==================================================  -->
<!-- == MAJORSTICK=7 Affichage Tranche de 4 Heures ========================  -->
<!-- == MAJORSTICK=9 Affichage Tranche de 3 Heures ========================  -->
<!-- == MINORSTICK=5 Affichage Tranche de 30 Minutes ======================  -->
	<ticks
		majorticks="7"
		minorticks="3"
		side="bottom"
		hidefirst="0"
		hidelast="0"
		hideminorticks="0"
		hide="0" />
</xaxis>
<!-- == AXES Y ============================================================  -->
		<y1axis
			color="FFFF0000"
			grid="0"
			autoscale="1"
			min="0"
			max="0"
			titleside="top"
			titlemargin="35">
<!-- == TITRE ECHELLE AXES Y ==============================================  -->
		<title
			text="Précipitations ($Unit[Rainfall])"
			alignement="20"
			angle="0">
			<font
			color="FFFFFFFF"
			facename="Arial"
			size="14"
			weight="800"
			italic="1" />
		</title>
<!-- == UNITES AXE Y ======================================================  -->
<!-- == LABEL=1 on Affiche TOUT ===========================================  -->
<!-- == LABEL=2 On affiche 1 sur 2 ========================================  -->
<!-- == FORMAT.1 Affiche 1 Chiffre Après la virgule =======================  -->
		<labels
			labelinterval="1"
			angle="0"
			format=".1"
			side="left"
			hide="0" >
				<font
				color="FFFFFFFF"
				facename="Arial"
				size="12"
				weight="800"
				italic="1" />
			</labels>
<!-- == GRADUATION AXE Y ==================================================  -->
			<ticks
				majorticks="4"
				minorticks="4"
				side="left"
				hidefirst="0"
				hidelast="0"
				hideminorticks="0"
				hide="0" />
		</y1axis>
<!-- == COURBES / DONNEES =================================================  -->
	<data>
		<relative_rainfall
		axisbind="y1axis"
		legend="PRECIPITATIONS ."
		color1="33FFFF00"
		color2="66FF0000"
		antialiasing="1"
		filled="1" />
			<relative_rainfall
			axisbind="y1axis"
			legend=""
			hidelegend="1"
			color1="FFFF0000"
			antialiasing="1"
			filled="0"
			thick="2"/>
    </data>
<!-- == CADRE LEGENDE =====================================================  -->
	<legend
		orientation="0"
		margin="000"
		width="250"
		position-x="350"
		position-y="8"
		hide="0"
		shadow="0">
		<font
			color="FFFFFFFF"
			facename="Arial"
			size="14"
			weight="800"
			italic="1" />
			<border
				cornerradius="10"
				color="00000000"
				thick="1" />
				<background
					color1="00000000"
					color2="00000000"
					gradient="1"
					gradient-direction="90"/>
	</legend>
<!-- == COURBES / DONNEES =================================================  -->
		<border
		cornerradius="0"
		color="5555555"
		thick="0" />
	<background
		color1="00000000"
		stretch="1" />
<!-- == FOND GRAPHIQUE ====================================================  -->
		<graphbackground
		color1="FF000000"
		color2="FF000000"
    	gradient="1"
    	gradient-direction="90" />
	</lineplot>
<!-- /////////////////////////////////////////////////////////////////////// -->
<!-- == PRECIPITATIONS 1 HEURE ============================================= -->
<!-- /////////////////////////////////////////////////////////////////////// -->
<!-- == CARACTERISTIQUE CADRE GRAPHIQUE ===================================  -->
<lineplot
		width="875"
		height="220"
		shadow="000"
		position-x="10"
		position-y="220"
		margin-top="20"
		margin-right="20"
		margin-bottom="30"
		margin-left="65">
		<border
		cornerradius="0"
		color="FF0000FF"
		thick="0" />
		<background
			color1="FF000000"
			stretch="1" />
<!-- == AXES ==============================================================  -->
<!-- == GRID=0 Pas Affichage ==============================================  -->
<!-- == GRID=1 Affichage ==================================================  -->
<!-- == AXES X ============================================================  -->
		<xaxis
			color="FFFF0000"
			grid="0"
			autoscale="0"
			min="0"
			max="0">
<!-- == TITRE ECHELLE AXES X ==============================================  -->
			<title
				text=""
				alignement="vcenter|hcenter"
				angle="0">
				<font
					color="FF000000"
					facename="Arial"
					size="12"
					weight="400"
					italic="1" />
			</title>
<!-- == UNITES AXE X ======================================================  -->
<!-- == LABEL=1 on Affiche TOUT ===========================================  -->
<!-- == LABEL=2 On affiche 1 sur 2 ========================================  -->
			<labels
				labelinterval="1"
				angle="0"
				side="left"
				hide="0">
				<font
					color="FFFFFFFF"
					facename="Arial"
					size="12"
					weight="800"
					italic="1" />
			</labels>
<!-- == GRADUATION AXE X =================================  -->
<!-- == MAJORSTICK=7 Affichage Tranche de 4 Heures =======  -->
<!-- == MAJORSTICK=9 Affichage Tranche de 3 Heures =======  -->
<!-- === MINORSTICK=3 Affichage Tranche de 60 Minutes =====  -->
			<ticks
				majorticks="7"
				minorticks="3"
				side="bottom"
				hidefirst="0"
				hidelast="0"
				hideminorticks="0"
				hide="0" />
		</xaxis>
<!-- == AXES Y ============================================================  -->
		<y1axis
			color="FFFF0000"
			grid="0"
			autoscale="1"
			min="0"
			max="0"
			titleside="top"
			titlemargin="35">
<!-- == TITRE ECHELLE AXES Y ==============================================  -->
		<title
			text="Précipitations ($Unit[Rainfall])"
			alignement="20"
			angle="0">
			<font
			color="FFFFFFFF"
			facename="Arial"
			size="14"
			weight="800"
			italic="1" />
		</title>
<!-- == UNITES AXE Y ======================================================  -->
<!-- == LABEL=1 on Affiche TOUT ===========================================  -->
<!-- == LABEL=2 On affiche 1 sur 2 ========================================  -->
<!-- == FORMAT.1 Affiche 1 Chiffre Après la virgule =======================  -->
		<labels
			labelinterval="1"
			angle="0"
			format=".1"
			side="left"
			hide="0" >
				<font
				color="FFFFFFFF"
				facename="Arial"
				size="12"
				weight="800"
				italic="1" />
			</labels>
<!-- == GRADUATION AXE Y ==================================================  -->
			<ticks
				majorticks="4"
				minorticks="4"
				side="left"
				hidefirst="0"
				hidelast="0"
				hideminorticks="0"
				hide="0" />
		</y1axis>
<!-- == COURBES / DONNEES =================================================  -->
	<data>
		<rainfall_1h
		axisbind="y1axis"
		legend="PRECIPITATIONS SUR 1 HEURE ."
		color1="33FFFF00"
		color2="66FF0000"
		antialiasing="1"
		filled="1" />
		<rainfall_1h
		axisbind="y1axis"
		legend=""
		hidelegend="1"
		color1="FFFF0000"
		antialiasing="1"
		filled="0"
		thick="2"/>
	</data>
<!-- === LEGENDE / CADRE LEGENDE ==========================================  -->
	<legend
		orientation="0"
		margin="000"
		width="250"
		position-x="350"
		position-y="221"
		hide="0"
		shadow="0">
		<font
			color="FFFFFFFF"
			facename="Arial"
			size="14"
			weight="800"
			italic="1" />
			<border
				cornerradius="10"
				color="00000000"
				thick="1" />
				<background
					color1="00000000"
					color2="00000000"
					gradient="1"
					gradient-direction="90"/>
	</legend>
<!-- == FOND GRAPHIQUE ====================================================  -->
		<graphbackground
		color1="FF000000"
		color2="FF000000"
		gradient="1"
		gradient-direction="90" />
	</lineplot>
<!-- /////////////////////////////////////////////////////////////////////// -->
<!-- == PRECIPITATION DERNIERE 24H00 ======================================= -->
<!-- /////////////////////////////////////////////////////////////////////// -->
<!-- == CARACTERISTIQUE CADRE GRAPHIQUE ===================================  -->
<lineplot
		width="875"
		height="220"
		shadow="000"
		position-x="10"
		position-y="445"
		margin-top="20"
		margin-right="20"
		margin-bottom="30"
		margin-left="65">
		<border
		cornerradius="0"
		color="FF0000FF"
		thick="0" />
		<background
			color1="FF000000"
			stretch="1" />
<!-- == AXES ==============================================================  -->
<!-- == GRID=0 Pas Affichage ==============================================  -->
<!-- == GRID=1 Affichage ==================================================  -->
<!-- == AXES X ============================================================  -->
<xaxis
	color="FFFF0000"
	grid="0"
	autoscale="0"
	min="0"
	max="0">
<!-- == TITRE ECHELLE AXES X ==============================================  -->
	<title
		text=""
		alignement="vcenter|hcenter"
		angle="0">
			<font
			color="FF000000"
			facename="Arial"
			size="12"
			weight="400"
			italic="1" />
	</title>
<!-- == UNITES AXE X ======================================================  -->
<!-- == LABEL=1 on Affiche TOUT ===========================================  -->
<!-- == LABEL=2 On affiche 1 sur 2 ========================================  -->
	<labels
		labelinterval="1"
		angle="0"
		side="left"
		hide="0">
			<font
			color="FFFFFFFF"
			facename="Arial"
			size="12"
			weight="800"
			italic="1" />
	</labels>
<!-- ================= GRADUATION AXE X =================================  -->
<!-- ================= MAJORSTICK=7 Affichage Tranche de 4 Heures =======  -->
<!-- ================= MAJORSTICK=9 Affichage Tranche de 3 Heures =======  -->
<!-- ================= MINORSTICK=5 Affichage Tranche de 30 Minutes =====  -->
	<ticks
		majorticks="7"
		minorticks="3"
		side="bottom"
		hidefirst="0"
		hidelast="0"
		hideminorticks="0"
		hide="0" />
</xaxis>
<!-- == AXES Y ============================================================  -->
<y1axis
	color="FFFF0000"
	grid="0"
	autoscale="1"
	min="0"
	max="0"
	titleside="top"
	titlemargin="35">
<!-- == TITRE ECHELLE AXES Y ==============================================  -->
	<title
		text="Précipitations ($Unit[Rainfall])"
		alignement="20"
		angle="0">
			<font
			color="FFFFFFFF"
			facename="Arial"
			size="14"
			weight="800"
			italic="1" />
	</title>
<!-- ================= UNITES AXE Y =======================================  -->
<!-- ================= LABEL=1 on Affiche TOUT ============================  -->
<!-- ================= LABEL=2 On affiche 1 sur 2 =========================  -->
<!-- ================= FORMAT.1 Affiche 1 Chiffre Après la virgule ========  -->
	<labels
		labelinterval="1"
		angle="0"
		format=".1"
		side="left"
		hide="0" >
			<font
			color="FFFFFFFF"
			facename="Arial"
			size="12"
			weight="800"
			italic="1" />
	</labels>
<!-- ================= GRADUATION AXE Y ===================================  -->
	<ticks
		majorticks="4"
		minorticks="4"
		side="left"
		hidefirst="0"
		hidelast="0"
		hideminorticks="0"
		hide="0" />
</y1axis>
<!-- ================= COURBES / DONNEES ==================================  -->
<data>
		<rainfall_24h
		axisbind="y1axis"
		legend="PRECIPITATIONS SUR DUREE DE 24H00."
		color1="33FFFF00"
		color2="66FF0000"
		antialiasing="1"
		filled="1" />
			<rainfall_24h
			axisbind="y1axis"
			legend=""
			hidelegend="1"
			color1="FFFF0000"
			antialiasing="1"
			filled="0"
		thick="2"/>
</data>
<!-- ================= CADRE LEGENDE ======================================  -->
<legend
		orientation="0"
		margin="5"
		width="250"
		position-x="350"
		position-y="441"
		hide="0"
		shadow="0">
			<font
			color="FFFFFFFF"
			facename="Arial"
			size="14"
			weight="800"
			italic="1" />
				<border
				cornerradius="000"
				color="00000000"
				thick="0" />
			<background
			color1="00000000"
			color2="00000000"
			gradient="1"
			gradient-direction="90"/>
</legend>
<!-- ================= FOND GRAPHIQUE =====================================  -->
		<graphbackground
		color1="FF000000"
		color2="FF000000"
		gradient="1"
		gradient-direction="90" />
	</lineplot>
<!-- //////////////////////////////////////////////////////////////////////  -->
<!-- == PRECIPITATIONS MENSUELLES =========================================  -->
<!-- /////////////////////////////////////////////////////////////////////// -->
<bargraph
	width="875"
	height="180"
	shadow="000"
	position-x="10"
	position-y="690"
	margin-top="20"
	margin-right="20"
	margin-bottom="30"
	margin-left="65">
		<border
		cornerradius="0"
		color="FF0000FF"
		thick="0" />
		<background
			color1="FFOOOO00"
			stretch="1" />
<!-- == AXES ==============================================================  -->
<!-- == GRID=0 Pas Affichage ==============================================  -->
<!-- == GRID=1 Affichage ==================================================  -->
<!-- == AXES X ============================================================  -->
	<xaxis
			color="FFFF0000"
			grid="0"
			autoscale="0"
			min="0"
			max="0">
<!-- == LABELS X ==========================================================  -->
	<labels
			labelinterval="1"
			labels=""
			angle="0"
			side="left"
			hide="1">
				<font
				color="FFFFFFFF"
				facename="Arial"
				size="12"
				weight="800"
				italic="1" />
			</labels>
<!-- == GRADUATIONS X =====================================================  -->
			<ticks
			majorticks="1"
			minorticks="0"
			side="bottom"
			hidefirst="0"
			hidelast="0"
			hideminorticks="0"
			hide="1" />
		</xaxis>
<!-- == AXES Y ============================================================  -->
		<y1axis
		color="FFFF0000"
		grid="0"
		autoscale="1"
		min="0"
		max="0"
		titleside="top"
		titlemargin="35">
<!-- == TITRE AXE Y =======================================================  -->
			<title
				text="Précipitations ( $Unit[Rainfall] )"
				alignement="vcenter|hcenter"
				angle="0">
				<font
					color="FFFFFFFF"
					facename="Arial"
					size="14"
					weight="800"
					italic="1" />
			</title>
<!-- == LABELS AXES Y =====================================================  -->
			<labels
				labelinterval="1"
				angle="0"
				format=".0"
				side="left"
				hide="0" >
				<font
					color="FFFFFFFF"
					facename="Arial"
					size="12"
					weight="400"
					italic="1" />
			</labels>
<!-- == GRADUATIONS AXES Y ================================================  -->
			<ticks
				majorticks="5"
				minorticks="4"
				side="left"
				hidefirst="0"
				hidelast="0"
				hideminorticks="0"
				hide="0" />
		</y1axis>
<!-- == DONNEES ===========================================================  -->
	<data>
	<stats_year_totalrainfall
		axisbind="y1axis"
		legend="PRECIPITATIONS MENSUELLES ."
		color1="33FFFF00"
		color2="FFFF0000"
		antialiasing="1"
		filled="0" />
		<stats_year_totalrainfall
			axisbind="y1axis"
			legend=""
			hidelegend="1"
			color1="FFFF0000"
			color2="33FFFF00"
			antialiasing="1"
			filled="0" />
	</data>
<!-- == LEGENDE GRAPHIQUE =================================================  -->
	<legend
		orientation="0"
		margin="000"
		width="250"
		position-x="300"
		position-y="671"
		hide="0"
		shadow="0">
			<font
			color="FFFFFFFF"
			facename="Arial"
			size="14"
			weight="800"
			italic="1" />
<!-- == ENCADREMENT LEGENDE ===============================================  -->
		<border
		cornerradius="000"
		color="00000000"
		thick="0" />
			<background
			color1="00000000"
			color2="00000000"
			gradient="1"
			gradient-direction="90"/>
	</legend>
<!-- == FOND GRAPHIQUE ====================================================  -->
	<graphbackground
		color1="FF000000"
		color2="FF000000"
		gradient="1"
		gradient-direction="90" />
	</bargraph>
<!-- == VALEUR JANVIER ==================================================== -->
	<textbox
		width="060"
		height="020"
		shadow="0"
		position-x="075"
		position-y="690"
		margin="00">
		<text alignement="center|top">
			<line text="$Stats[201501,TotalRainfall]"/>
				<font
				color="FFFFFFFF"
				facename="Comic sans ms"
				size="18"
				weight="600"
				italic="0" />
		</text>
		<background color="00000000"/>
	</textbox>
<!-- == VALEUR FEVRIER ==================================================== -->
	<textbox
		width="060"
		height="020"
		shadow="0"
		position-x="142"
		position-y="690"
		margin="00">
		<text alignement="center|top">
			<line text="$Stats[201502,TotalRainfall]"/>
				<font
				color="FFFFFFFF"
				facename="Comic sans ms"
				size="18"
				weight="600"
				italic="0" />
		</text>
		<background color="00000000"/>
	</textbox>
<!-- == VALEUR MARS ==================================================== -->
	<textbox
		width="060"
		height="020"
		shadow="0"
		position-x="207"
		position-y="690"
		margin="00">
		<text alignement="center|top">
			<line text="$Stats[201503,TotalRainfall]"/>
				<font
				color="FFFFFFFF"
				facename="Comic sans ms"
				size="18"
				weight="600"
				italic="0" />
		</text>
		<background color="00000000"/>
	</textbox>
<!-- == VALEUR AVRIL ==================================================== -->
	<textbox
		width="060"
		height="020"
		shadow="0"
		position-x="273"
		position-y="690"
		margin="00">
		<text alignement="center|top">
			<line text="$Stats[201504,TotalRainfall]"/>
				<font
				color="FFFFFFFF"
				facename="Comic sans ms"
				size="18"
				weight="600"
				italic="0" />
		</text>
		<background color="00000000"/>
	</textbox>
<!-- == VALEUR MAI ==================================================== -->
	<textbox
		width="060"
		height="020"
		shadow="0"
		position-x="338"
		position-y="690"
		margin="00">
		<text alignement="center|top">
			<line text="$Stats[201505,TotalRainfall]"/>
				<font
				color="FFFFFFFF"
				facename="Comic sans ms"
				size="18"
				weight="600"
				italic="0" />
		</text>
		<background color="00000000"/>
	</textbox>
<!-- == VALEUR JUIN ==================================================== -->
	<textbox
		width="060"
		height="020"
		shadow="0"
		position-x="405"
		position-y="690"
		margin="00">
		<text alignement="center|top">
			<line text="$Stats[201506,TotalRainfall]"/>
				<font
				color="FFFFFFFF"
				facename="Comic sans ms"
				size="18"
				weight="600"
				italic="0" />
		</text>
		<background color="00000000"/>
	</textbox>
<!-- == VALEUR JUILLET ==================================================== -->
	<textbox
		width="060"
		height="020"
		shadow="0"
		position-x="471"
		position-y="690"
		margin="00">
		<text alignement="center|top">
			<line text="$Stats[201507,TotalRainfall]"/>
				<font
				color="FFFFFFFF"
				facename="Comic sans ms"
				size="18"
				weight="600"
				italic="0" />
		</text>
		<background color="00000000"/>
	</textbox>
<!-- == VALEUR AOUT ==================================================== -->
	<textbox
		width="060"
		height="020"
		shadow="0"
		position-x="536"
		position-y="690"
		margin="00">
		<text alignement="center|top">
			<line text="$Stats[201508,TotalRainfall]"/>
				<font
				color="FFFFFFFF"
				facename="Comic sans ms"
				size="18"
				weight="600"
				italic="0" />
		</text>
		<background color="00000000"/>
	</textbox>
<!-- == VALEUR SEPTEMBRE ==================================================== -->
	<textbox
		width="060"
		height="020"
		shadow="0"
		position-x="602"
		position-y="690"
		margin="00">
		<text alignement="center|top">
			<line text="$Stats[201509,TotalRainfall]"/>
				<font
				color="FFFFFFFF"
				facename="Comic sans ms"
				size="18"
				weight="600"
				italic="0" />
		</text>
		<background color="00000000"/>
	</textbox>
<!-- == VALEUR OCTOBRE ==================================================== -->
	<textbox
		width="060"
		height="020"
		shadow="0"
		position-x="667"
		position-y="690"
		margin="00">
		<text alignement="center|top">
			<line text="$Stats[201510,TotalRainfall]"/>
				<font
				color="FFFFFFFF"
				facename="Comic sans ms"
				size="18"
				weight="600"
				italic="0" />
		</text>
		<background color="00000000"/>
	</textbox>
<!-- == VALEUR NOVEMBRE ==================================================== -->
	<textbox
		width="060"
		height="020"
		shadow="0"
		position-x="733"
		position-y="690"
		margin="00">
		<text alignement="center|top">
			<line text="$Stats[201511,TotalRainfall]"/>
				<font
				color="FFFFFFFF"
				facename="Comic sans ms"
				size="18"
				weight="600"
				italic="0" />
		</text>
		<background color="00000000"/>
	</textbox>
<!-- == VALEUR DECEMBRE ==================================================== -->
	<textbox
		width="060"
		height="020"
		shadow="0"
		position-x="798"
		position-y="690"
		margin="00">
		<text alignement="center|top">
			<line text="$Stats[201512,TotalRainfall]"/>
				<font
				color="FFFFFFFF"
				facename="Comic sans ms"
				size="18"
				weight="600"
				italic="0" />
		</text>
		<background color="00000000"/>
	</textbox>
<!-- ///////////////////////////////////////////////////////////////////////////// -->
<!-- == GRAPHISME ================================================================ -->
<!-- ///////////////////////////////////////////////////////////////////////////// -->
<!-- == LIGNE HORIZONTALE 1 (05) ================================================= -->
<frame
	width="875"
	height="005"
	shadow="0"
	position-x="010"
	position-y="005"
	margin="10">
		<background
			color1="FF696969"
			color2=""
			gradient="0"
			gradient-direction="90"
			stretch="1" />
			<border
				cornerradius="0"
				color="FF696969"
				thick="1" />
</frame>
<!-- == LIGNE HORIZONTALE 2 (03) ================================================= -->
<frame
	width="875"
	height="005"
	shadow="0"
	position-x="010"
	position-y="215"
	margin="10">
		<background
			color1="FF696969"
			color2=""
			gradient="0"
			gradient-direction="90"
			stretch="1" />
			<border
				cornerradius="0"
				color="FF696969"
				thick="1" />
</frame>
<!-- == LIGNE HORIZONTALE 3 (03) ================================================= -->
<frame
	width="875"
	height="005"
	shadow="0"
	position-x="010"
	position-y="440"
	margin="10">
		<background
			color1="FF696969"
			color2=""
			gradient="0"
			gradient-direction="90"
			stretch="1" />
			<border
				cornerradius="0"
				color="FF696969"
				thick="1" />
</frame>
<!-- == LIGNE HORIZONTALE 4 (03) ================================================= -->
<frame
	width="875"
	height="005"
	shadow="0"
	position-x="010"
	position-y="665"
	margin="10">
		<background
			color1="FF696969"
			color2=""
			gradient="0"
			gradient-direction="90"
			stretch="1" />
			<border
				cornerradius="0"
				color="FF696969"
				thick="1" />
</frame>
<!-- == LIGNE HORIZONTALE 5 (05) ================================================= -->
<frame
	width="875"
	height="005"
	shadow="0"
	position-x="010"
	position-y="870"
	margin="10">
		<background
			color1="FF696969"
			color2=""
			gradient="0"
			gradient-direction="90"
			stretch="1" />
			<border
				cornerradius="0"
				color="FF696969"
				thick="1" />
</frame>
<!-- == LIGNE VERICALE 1 (05) ==================================================== -->
<frame
	width="005"
	height="870"
	shadow="0"
	position-x="010"
	position-y="005"
	margin="10">
		<background
			color1="FF696969"
			color2=""
			gradient="0"
			gradient-direction="90"
			stretch="1" />
			<border
				cornerradius="0"
				color="FF696969"
				thick="1" />
</frame>
<!-- == LIGNE VERICALE 2 (05) ==================================================== -->
<frame
	width="005"
	height="870"
	shadow="0"
	position-x="885"
	position-y="005"
	margin="10">
		<background
			color1="FF696969"
			color2=""
			gradient="0"
			gradient-direction="90"
			stretch="1" />
			<border
				cornerradius="0"
				color="FF696969"
				thick="1" />
</frame>
<!-- == LIGNE VERICALE BARGRAPH FEVRIER (02) ===================================== -->
<frame
	width="002"
	height="150"
	shadow="0"
	position-x="140"
	position-y="690"
	margin="10">
		<background
			color1="FF696969"
			color2=""
			gradient="0"
			gradient-direction="90"
			stretch="1" />
			<border
				cornerradius="0"
				color="FF696969"
				thick="1" />
</frame>
<!-- == LIGNE VERICALE BARGRAPH MARS (02) ======================================== -->
<frame
	width="002"
	height="150"
	shadow="0"
	position-x="205"
	position-y="690"
	margin="10">
		<background
			color1="FF696969"
			color2=""
			gradient="0"
			gradient-direction="90"
			stretch="1" />
			<border
				cornerradius="0"
				color="FF696969"
				thick="1" />
</frame>
<!-- == LIGNE VERICALE BARGRAPH AVRIL (02) ======================================= -->
<frame
	width="002"
	height="150"
	shadow="0"
	position-x="271"
	position-y="690"
	margin="10">
		<background
			color1="FF696969"
			color2=""
			gradient="0"
			gradient-direction="90"
			stretch="1" />
			<border
				cornerradius="0"
				color="FF696969"
				thick="1" />
</frame>
<!-- == LIGNE VERICALE BARGRAPH MAI (02) ========================================= -->
<frame
	width="002"
	height="150"
	shadow="0"
	position-x="337"
	position-y="690"
	margin="10">
		<background
			color1="FF696969"
			color2=""
			gradient="0"
			gradient-direction="90"
			stretch="1" />
			<border
				cornerradius="0"
				color="FF696969"
				thick="1" />
</frame>
<!-- == LIGNE VERICALE BARGRAPH JUILLET (02) ===================================== -->
<frame
	width="002"
	height="150"
	shadow="0"
	position-x="403"
	position-y="690"
	margin="10">
		<background
			color1="FF696969"
			color2=""
			gradient="0"
			gradient-direction="90"
			stretch="1" />
			<border
				cornerradius="0"
				color="FF696969"
				thick="1" />
</frame>
<!-- == LIGNE VERICALE BARGRAPH JUILLET (02) ===================================== -->
<frame
	width="002"
	height="150"
	shadow="0"
	position-x="469"
	position-y="690"
	margin="10">
		<background
			color1="FF696969"
			color2=""
			gradient="0"
			gradient-direction="90"
			stretch="1" />
			<border
				cornerradius="0"
				color="FF696969"
				thick="1" />
</frame>
<!-- == LIGNE VERICALE BARGRAPH AOUT (02) ======================================== -->
<frame
	width="002"
	height="150"
	shadow="0"
	position-x="535"
	position-y="690"
	margin="10">
		<background
			color1="FF696969"
			color2=""
			gradient="0"
			gradient-direction="90"
			stretch="1" />
			<border
				cornerradius="0"
				color="FF696969"
				thick="1" />
</frame>
<!-- == LIGNE VERICALE BARGRAPH SEPTEMBRE (02) =================================== -->
<frame
	width="002"
	height="150"
	shadow="0"
	position-x="601"
	position-y="690"
	margin="10">
		<background
			color1="FF696969"
			color2=""
			gradient="0"
			gradient-direction="90"
			stretch="1" />
			<border
				cornerradius="0"
				color="FF696969"
				thick="1" />
</frame>
<!-- == LIGNE VERICALE BARGRAPH OCTOBRE (02) ===================================== -->
<frame
	width="002"
	height="150"
	shadow="0"
	position-x="667"
	position-y="690"
	margin="10">
		<background
			color1="FF696969"
			color2=""
			gradient="0"
			gradient-direction="90"
			stretch="1" />
			<border
				cornerradius="0"
				color="FF696969"
				thick="1" />
</frame>
<!-- == LIGNE VERICALE BARGRAPH NOVEMBRE (02) ==================================== -->
<frame
	width="002"
	height="150"
	shadow="0"
	position-x="732"
	position-y="690"
	margin="10">
		<background
			color1="FF696969"
			color2=""
			gradient="0"
			gradient-direction="90"
			stretch="1" />
			<border
				cornerradius="0"
				color="FF696969"
				thick="1" />
</frame>
<!-- == LIGNE VERICALE BARGRAPH DECEMBRE (02) ==================================== -->
<frame
	width="002"
	height="150"
	shadow="0"
	position-x="797"
	position-y="690"
	margin="10">
		<background
			color1="FF696969"
			color2=""
			gradient="0"
			gradient-direction="90"
			stretch="1" />
			<border
				cornerradius="0"
				color="FF696969"
				thick="1" />
</frame>
<!-- == PRECIPITATIONS ANNUELLES ===================================================== -->
	<textbox
		width="220"
		height="020"
		shadow="0"
		position-x="650"
		position-y="670"
		margin="00">
		<text alignement="center|top">
			<line text="CUMUL ANNUEL : $Stats[Year,TotalRainfall] (mm)"/>
				<font
				color="FFFF0000"
				facename="Comic sans ms"
				size="18"
				weight="600"
				italic="0" />
		</text>
		<background color="00000000"/>
	</textbox>
<!-- ///////////////////////////////////////////////////////////////////////////// -->
<!-- == AFFICHAGE DES MOIS ======================================================= -->
<!-- ///////////////////////////////////////////////////////////////////////////// -->
	<textbox
		width="800"
		height="020"
		shadow="1"
		position-x="075"
		position-y="845"
		margin="000">
			<background
			color1="000000FF" />
				<text
				alignement="left|top">
					<line text="  JANVIER        FEVRIER          MARS             AVRIL              MAI              JUIN            JUILLET          AOUT       SEPTEMBRE   OCTOBRE    NOVEMBRE    DECEMBRE" />
						<font
							facename="Arial"
							color="FFFFFFFF"
							size="12"
							weight="800"
							italic="0" />
				</text>
	</textbox>
<!-- == COPYRIGHT ============================================================= -->
	<textbox
		width="300"
		height="017"
		shadow="0"
		position-x="585"
		position-y="860"
		margin="00">
		<text alignement="center|top">
			<line text="© GROGNON 2012 VIRUSDUNIL 2015"/>
				<font
				color="FFFF9900"
				facename="Comic sans ms"
				size="16"
				weight="800"
				italic="0" />
		</text>
		<border
			cornerradius="005"
			color="FF696969"
			thick="001" />
		<background color="FF000000"/>
	</textbox>
</stylesheet>
-
Pierre50500
- Membre
- Messages : 31
- Inscription : lun. janv. 12, 2015 6:39 pm
- Localisation : Carentan
- Contact :
Résolu Re: nombre jour pluie par mois
merci pour le code carl
Pierre
Pierre
Station Orégon scientifique WMR 200 complète avec Sonde UV installée le 25/12/2014.
Logiciels: Graphweather 3.0.15, Xnet météo 2014-10-29a, et site météo villarzel.
Windows 7 64 bits
PC: HP G72 4 Go ram
Site: http://meteo50500.free.fr/]
Logiciels: Graphweather 3.0.15, Xnet météo 2014-10-29a, et site météo villarzel.
Windows 7 64 bits
PC: HP G72 4 Go ram
Site: http://meteo50500.free.fr/]