(terminé)besoin d'aide pour finaliser mon barographe

Répondre
Avatar de l’utilisateur
paaubert
Membre
Messages : 2624
Inscription : dim. janv. 17, 2010 7:16 pm
Localisation : 1555 Villarzel - Switzerland
Contact :

(terminé)besoin d'aide pour finaliser mon barographe

Message par paaubert »

Bonjour,
j'ai besoin d'aide pour mon barographe
Image

Je n'arrive pas a mettre une échelle fixe sur l'axe du graphique, sur l'axe "circulargauge" j'ai mis une échelle de 980 à 1040 et il faudrait la même échelle fixe sur l'axe du graphique, sinon l'aiguille ne suis pas la courbe.
J'ai essayé avec ça <xaxis color="00FFFFFF" min="980" max="1040"></xaxis>
mais cela ne fonctionne pas.


Image

Merci pour votre aide.

Dès qu'il sera fini, je mettrai les images et le fichier xml a disposition.
Dernière modification par paaubert le ven. févr. 12, 2010 8:41 pm, modifié 1 fois.
_________________________________________________________________________________________________________
Station Vantage Pro2+ avec station agricole - Weatherlink 6.0.3 - GraphWeather 3.0.15b - Cumulus 1.9.4 - Windows W10 ultimate x64
http://www.boock.ch/meteo-villarzel.php
Image
Avatar de l’utilisateur
jturlier
Membre
Messages : 3149
Inscription : mar. août 22, 2006 8:38 am
Localisation : 34410 Sérignan - Languedoc
Contact :

Re: besoin d'aide pour finaliser mon barographe

Message par jturlier »

Bonjour, as-tu essayé de superposer 2 circulargauges ?
Je ne suis pas sûr de bien comprendre ce que tu souhaites faire, qq chose comme ça ? :

<?xml version="1.0" encoding="iso-8859-1" ?>
<stylesheet>
<image width="800" height="800" />
<!-- ================= Outdoor Temperature ================= -->
<!-- ================= Relative Pressure ================= -->
<circulargauge width="800" height="800" shadow="0" orientation="1" position-x="0" position-y="000" margin-top="50" margin-right="50" margin-bottom="50" margin-left="50" >
<axis color="FF000000" min="940" max="1010" titlemargin="50" titleside="top" fromangle="-225" toangle="-135">
<title text="Pression\nrelative" alignement="vcenter|hcenter" angle="0">
<font color="FF000000" facename="Arial" size="18" weight="400" italic="1" />
</title>
<labels labelinterval="1" side="0" hide="0">
<font color="FF000000" facename="Arial" size="14" weight="400" italic="0" />
</labels>
<ticks majorticks="7" minorticks="3" side="left" hidefirst="0" hidelast="0" hideminorticks="0" hide="0" minorticksize="5" majorticksize="9"/>
</axis>
<index>
<current_relative_pressure color1="FF00FF00" color2="FF00FF00" filled="1" side="left" thick="9" axisdelta="0"/>
</index>
</circulargauge>
<circulargauge width="560" height="800" shadow="0" orientation="1" position-x="120" position-y="120" margin-top="50" margin-right="50" margin-bottom="50" margin-left="50" >
<axis color="FF000000" min="980" max="1040" titlemargin="50" titleside="top" fromangle="-225" toangle="-135">
<title text="Pression\nrelative" alignement="vcenter|hcenter" angle="0">
<font color="FF000000" facename="Arial" size="18" weight="400" italic="1" />
</title>
<labels labelinterval="1" side="0" hide="0">
<font color="FF000000" facename="Arial" size="14" weight="400" italic="0" />
</labels>
<ticks majorticks="7" minorticks="3" side="left" hidefirst="0" hidelast="0" hideminorticks="0" hide="0" minorticksize="5" majorticksize="9"/>
</axis>
<index>
<current_relative_pressure color1="FFFF0000" color2="FF00FF00" filled="1" side="left" thick="1" axisdelta="0"/>
</index>
</circulargauge>
</stylesheet>


Jean
Avatar de l’utilisateur
paaubert
Membre
Messages : 2624
Inscription : dim. janv. 17, 2010 7:16 pm
Localisation : 1555 Villarzel - Switzerland
Contact :

Re: besoin d'aide pour finaliser mon barographe

Message par paaubert »

Salut Jean,
merci pour la réponse, mais ce n'est pas ce que je cherche a faire.

J'ai besoin d'une zone avec un graphique (rouge) pour tracer la courbe de pression (sur le rouleau papier) et un circulargauges uniquement pour faire bouger l'aiguille. Mais comme la plage du graphique (en rouge) change automatiquement, la fin du tracé (bleu) n'est jamais aligné avec l'aiguille qui suit la circulargauges (en vert). Ce que j'aimerai, c'est de fixer la range du graphique entre 980 et 1040 comme pour la circulargauge.

Image

Merci
_________________________________________________________________________________________________________
Station Vantage Pro2+ avec station agricole - Weatherlink 6.0.3 - GraphWeather 3.0.15b - Cumulus 1.9.4 - Windows W10 ultimate x64
http://www.boock.ch/meteo-villarzel.php
Image
Avatar de l’utilisateur
jturlier
Membre
Messages : 3149
Inscription : mar. août 22, 2006 8:38 am
Localisation : 34410 Sérignan - Languedoc
Contact :

Re: besoin d'aide pour finaliser mon barographe

Message par jturlier »

Re-bonjour,
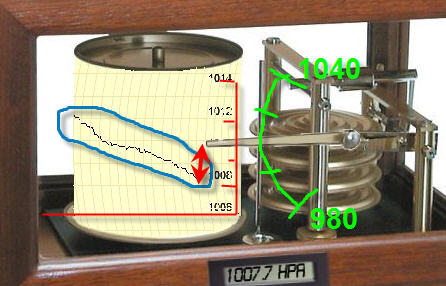
tu es confronté à une impossibilité pour avoir qq chose de parfait : faire correspondre un mouvement circulaire (ton aiguille avec un mouvement linéaire le graphe.
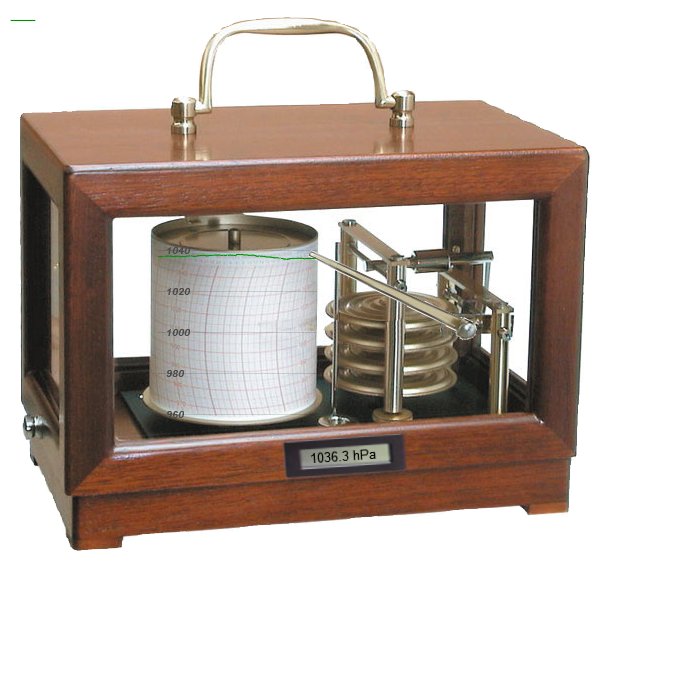
Tu peux maquiller un peu l'image, voici d'ailleurs le moins moche que j'ai pu faire (sans redessiner une aiguille)
PAABarographe.jpg

<?xml version="1.0" encoding="iso-8859-1" ?>
<stylesheet>
<image width="800" height="800" />
<!-- ================= Relative Pressure ================= -->
<!-- ================= on essaie d'avoir l'aiguille la plus longue possible, -->
<circulargauge width="1200" height="1000" shadow="0" orientation="1" position-x="150" position-y="-52" margin-top="00" margin-right="50" margin-bottom="100" margin-left="50" >
<!-- on cache l'échelle de la grande jauge-->
<axis color="00000000" min="960" max="1040" titlemargin="50" titleside="top" fromangle="-225" toangle="-135">
<labels labelinterval="1" side="0" hide="0">
<font color="00000000" facename="Arial" size="14" weight="400" italic="0" />
</labels>
<ticks majorticks="7" minorticks="3" side="left" hidefirst="0" hidelast="0" hideminorticks="0" hide="0" minorticksize="5" majorticksize="9"/>
</axis>
<index>
<current_relative_pressure color1="FF009000" color2="FF009000" filled="0" side="left" thick="9" axisdelta="0"/>
</index>
</circulargauge>
<circulargauge width="760" height="800" shadow="0" orientation="1" position-x="270" position-y="72" margin-top="00" margin-right="50" margin-bottom="100" margin-left="50" >
<axis color="FF000000" min="960" max="1040" titlemargin="50" titleside="top" fromangle="-225" toangle="-135">
<labels labelinterval="1" side="0" hide="0">
<font color="FF000000" facename="Arial" size="14" weight="400" italic="0" />
</labels>
<ticks majorticks="7" minorticks="3" side="left" hidefirst="0" hidelast="0" hideminorticks="0" hide="0" minorticksize="5" majorticksize="9"/>
</axis>
<index>

<current_relative_pressure color1="00009000" color2="00009000" filled="0" side="left" />
</index>
</circulargauge>
<lineplot width="280" height="800" shadow="0" position-x="10" position-y="0" margin-top="100" margin-right="0" margin-bottom="100" margin-left="0">
<xaxis color="FF000000" grid="1" autoscale="0" min="0" max="0">
<title text="" alignement="vcenter|hcenter" angle="0">
<font color="FF000000" facename="Arial" size="12" weight="400" italic="1" />
</title>
<ticks majorticks="5" minorticks="3" side="bottom" hidefirst="0" hidelast="0" hideminorticks="0" hide="0" />
</xaxis>
<y1axis color="FF000000" grid="1" autoscale="0" min="960" max="1040" titleside="top" titlemargin="35">
<labels labelinterval="1" angle="0" format=".0" side="right" hide="0" >
<font color="FF000000" facename="Arial" size="16" weight="800" italic="1" />
</labels>
<ticks majorticks="5" minorticks="4" side="left" hidefirst="0" hidelast="0" hideminorticks="0" hide="0" />
</y1axis>
<data>
<relative_pressure axisbind="y1axis" color1="FF009000" color2="FF009000" antialiasing="1" filled="0" hide="0" thick="1.2" />
</data>
<background color="ffffffff"/>
</lineplot>
</stylesheet>

Je ne peux pas commenter à l'intérieur, des balises, cela pose des pb d'exécution.
Le graphe linéaire a un fond blanc non transparent pour cacher le bout de l'aiguille.
La jauge qui porte l'aiguille est dessinée la plus large possible pour que l'échelle circulaire ait une courbe réduite

Si cela t'intéresse, tu peux trouver la syntaxe applicable aux balises des graphiques de GW sur mon site : http://meteozoir.homeip.net/doc_objets.htm

Bonne fin d'après-midi

Jean
Vous ne pouvez pas consulter les pièces jointes insérées à ce message.
Avatar de l’utilisateur
paaubert
Membre
Messages : 2624
Inscription : dim. janv. 17, 2010 7:16 pm
Localisation : 1555 Villarzel - Switzerland
Contact :

Re: besoin d'aide pour finaliser mon barographe

Message par paaubert »

Jean,
Super merci pour ton aide, je vais essayer ça ce soir, je pense que autoscale="0" est ce que je cherchai, je suis conscient que cela ne peut pas être parfait (adapter un rond sur un carré !!!) mais je trouvai l'idée du barographe intéressante comme figure de style.
_________________________________________________________________________________________________________
Station Vantage Pro2+ avec station agricole - Weatherlink 6.0.3 - GraphWeather 3.0.15b - Cumulus 1.9.4 - Windows W10 ultimate x64
http://www.boock.ch/meteo-villarzel.php
Image
Avatar de l’utilisateur
paaubert
Membre
Messages : 2624
Inscription : dim. janv. 17, 2010 7:16 pm
Localisation : 1555 Villarzel - Switzerland
Contact :

Re: besoin d'aide pour finaliser mon barographe

Message par paaubert »

Encore merci à Jean pour son aide, le résultat ici
http://www.boock.ch/meteo/creations.php
_________________________________________________________________________________________________________
Station Vantage Pro2+ avec station agricole - Weatherlink 6.0.3 - GraphWeather 3.0.15b - Cumulus 1.9.4 - Windows W10 ultimate x64
http://www.boock.ch/meteo-villarzel.php
Image
Avatar de l’utilisateur
COULET
Membre
Messages : 805
Inscription : sam. mai 13, 2006 5:04 pm
Localisation : MONTPELLIER
Contact :

Re: besoin d'aide pour finaliser mon barographe

Message par COULET »

Salut a tous !

Super ton barographe ! :D
Pourrais tu mettre ne ligne le code ?
Merci d'avance ! :wink:
P COULET :cool:


Vantage Vue - GW 3.0.15 - Windows 10 - Cumulus
Avatar de l’utilisateur
paaubert
Membre
Messages : 2624
Inscription : dim. janv. 17, 2010 7:16 pm
Localisation : 1555 Villarzel - Switzerland
Contact :

Re: besoin d'aide pour finaliser mon barographe

Message par paaubert »

_________________________________________________________________________________________________________
Station Vantage Pro2+ avec station agricole - Weatherlink 6.0.3 - GraphWeather 3.0.15b - Cumulus 1.9.4 - Windows W10 ultimate x64
http://www.boock.ch/meteo-villarzel.php
Image
Avatar de l’utilisateur
MAGNUS
Membre
Messages : 992
Inscription : dim. mars 26, 2006 4:44 pm
Localisation : VIDAUBAN (83) FRANCE
Contact :

Re: besoin d'aide pour finaliser mon barographe

Message par MAGNUS »

paaubert a écrit :Voila, comme promis.

http://www.boock.ch/meteo/barographe.zip
Bonjour paaubert,

Félicitations pour cette belle réalisation.
Cordialement.
Station WMR 200 avec XNet_meteo V 2014-10-29a Logiciels:Graphweather V 3.0.16, Noaa Template2, Windows 7
Mon abri météo ici :http://www.vardecouverte.fr/sta%20bc2008.htm
Site Web : http://www.vardecouverte.fr
Image
Répondre