paaubert a écrit :Salut Michel
Dans les paramètres d'exportation il ne faut pas mettre année en cours, mais mois en cours.
A+
Ps: ce fichier xml n'est pas de moi, rendons à César ce qui appartient à César

Par contre je ne me rappel plus l'auteur

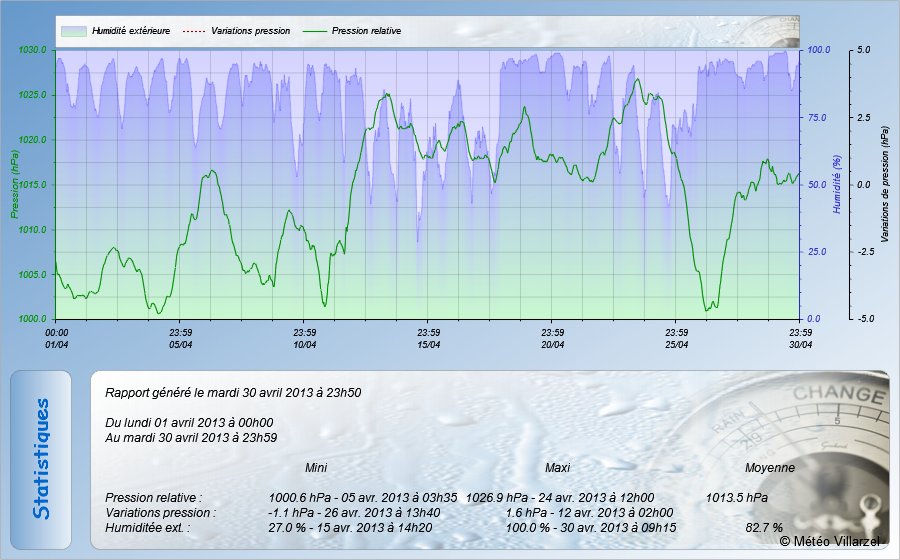
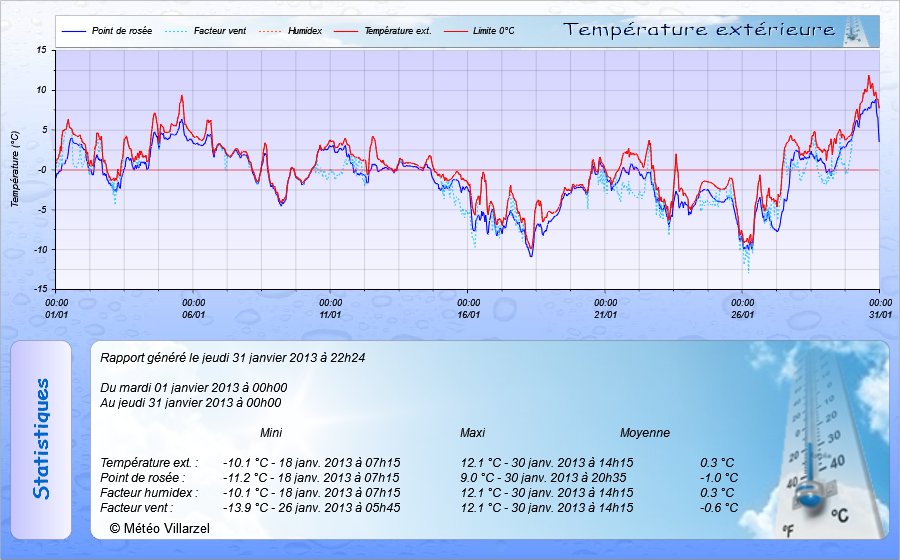
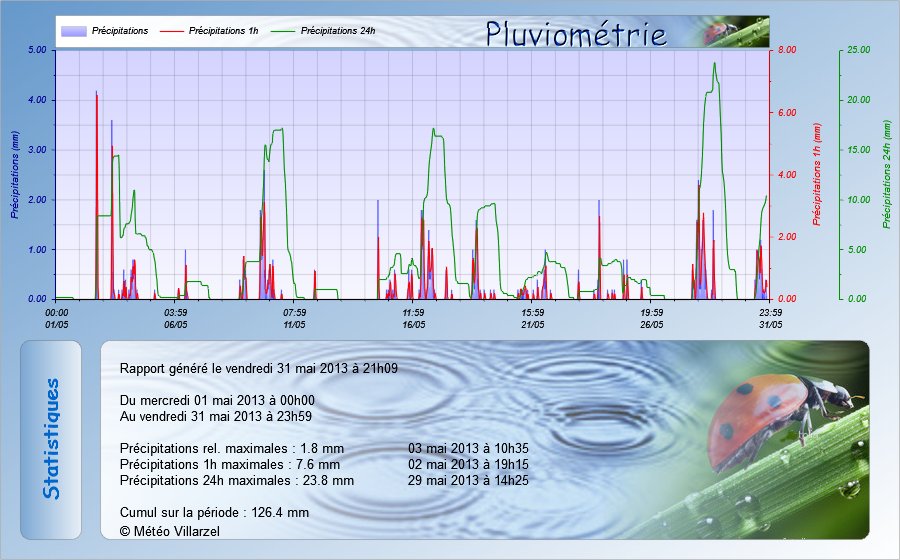
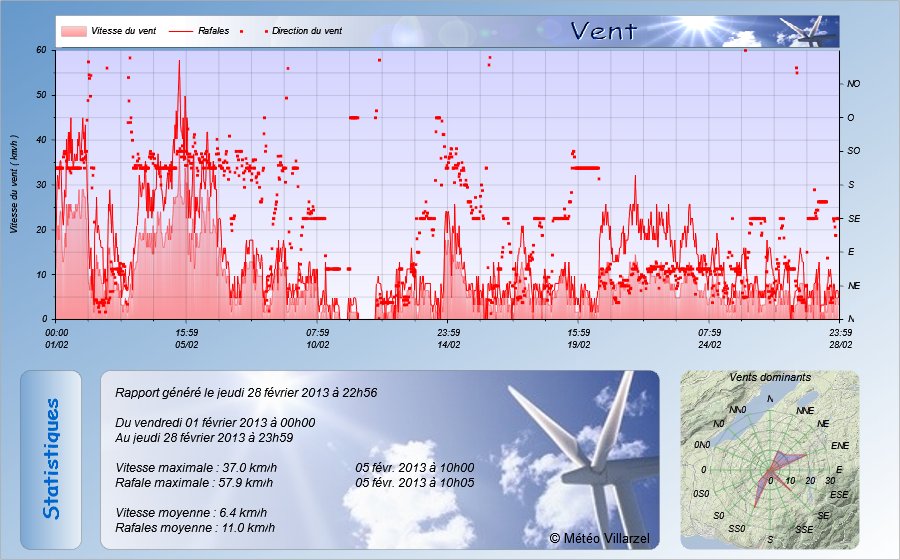
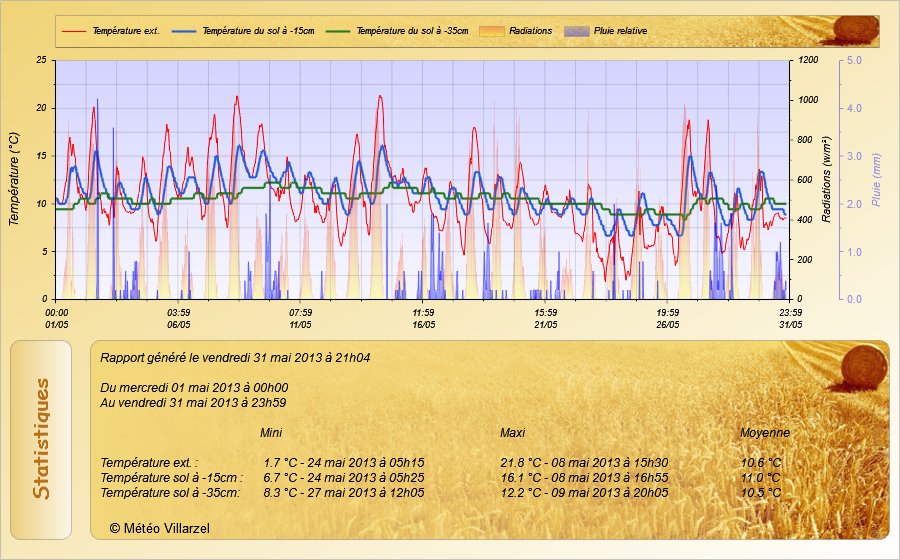
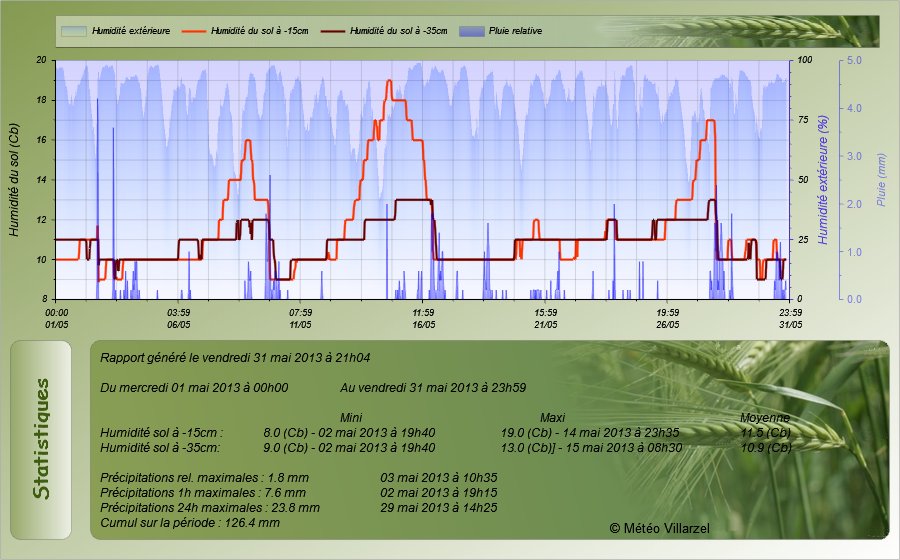
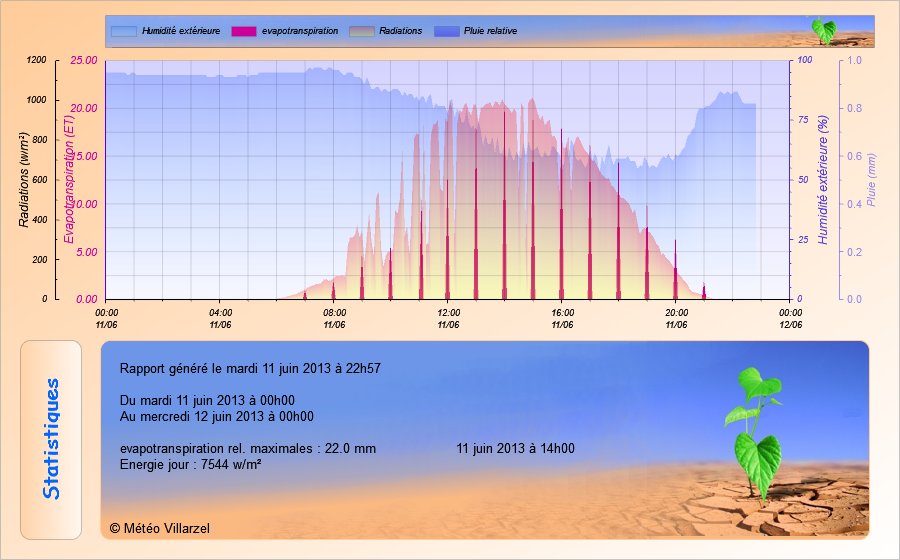
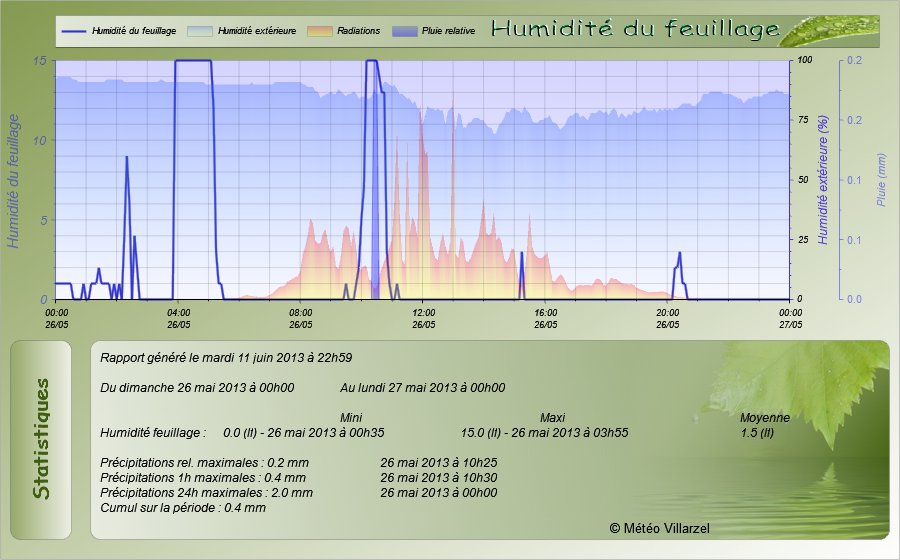
Bonjour Pierre-André, je crois bien qu'il est de moi et je vous en livre une nouvelle version mais elle comporte des graphiques depuis 2006, aux utilisateurs de l'aménager :
<?xml version="1.0" encoding="iso-8859-1" ?>
<stylesheet>
<image width="650" height="770" />
<frame width="650" height="770" position-x="0" position-y="0" shadow="0">
<title text="" alignement="3" angle="0">
<font color="FF000000" facename="Arial" size="14" weight="400" italic="0" />
</title>
<background color1="FFFFFFFF" color2="FF79BCFF" gradient="1" gradient-direction="90" />
<border cornerradius="0" color="55555555" thick="1" />
</frame>
<!-- ================= graph pluie annuelle depuis 2006 ================= -->
<bargraph width="600" height="200" shadow="0" position-x="25" position-y="560" margin-top="0" margin-right="20" margin-bottom="30" margin-left="40">
<xaxis color="FF000000" grid="1" autoscale="1" min="0" max="0">
<labels labelinterval="1" angle="0" side="left" hide="0" format="%Y">
<font color="FF0000FF" facename="Arial" size="14" weight="400" italic="0" />
</labels>
<ticks majorticks="7" minorticks="4" side="bottom" hidefirst="0" hidelast="0" hideminorticks="0" hide="0" />
</xaxis>
<y1axis color="FF0000FF" grid="1" autoscale="1" min="0" max="1300" y-base="0.0" titleside="left" titlemargin="25">
<title text="Précipitations ($UNIT[Rainfall])" alignement="vcenter|hcenter" angle="0">
<font color="" facename="Arial" size="10" weight="400" italic="0" />
</title>
<labels labelinterval="1" angle="0" format=".0" side="left" hide="0" >
<font color="FF0000FF" facename="Arial" size="14" weight="400" italic="0" />
</labels>
<ticks majorticks="29" minorticks="4" side="left" hidefirst="0" hidelast="0" hideminorticks="0" hide="0" />
</y1axis>
<data>
<stats_full_totalrainfall axisbind="y1axis" legend=" " color1="FF0000FF" color2="FF80FFFF" gradient="vertical" antialiasing="1" filled="1" />
</data>
<legend orientation="0" margin="3" width="300" position-x="-34" position-y="520" hide="0" shadow="0">
<font color="FF0000FF" facename="Arial" size="13" weight="400" italic="0" />
<border cornerradius="0" color="" thick="1" />
<background color1="" color2="" gradient="1" gradient-direction="90"/>
</legend>
<graphbackground color1="" color2="" gradient="1" gradient-direction="90" />
</bargraph>
<!-- ================= mois en cours ================= -->
<bargraph width="675" height="250" shadow="0" position-x="0" position-y="90" margin-top="40" margin-right="70" margin-bottom="50" margin-left="65">
<xaxis color="FF0000FF" grid="1" autoscale="0" min="0" max="0">
<title text="" alignement="20" angle="0">
<font color="FF0062C4" facename="Arial" size="16" weight="400" italic="0" />
</title>
<labels labelinterval="1" angle="0" format="%d" side="2" hide="0">
<font color="FF0000FF" facename="Arial" size="14" weight="400" italic="0" />
</labels>
<ticks majorticks="32" minorticks="0" side="0" hidefirst="0" hidelast="0" hideminorticks="0" hide="0" />
</xaxis>
<y1axis color="FF0000FF" grid="1" autoscale="1" min="0" max="80" y-base="0.0" titleside="left" titlemargin="35">
<title text="Précipitations ( $Unit[Rainfall] )" alignement="vcenter|hcenter" angle="0">
<font color="" facename="Time new roman" size="16" weight="400" italic="0" />
</title>
<labels labelinterval="1" angle="0" format=".1" side="left" hide="0" >
<font color="FF0000FF" facename="Arial" size="14" weight="400" italic="0" />
</labels>
<ticks majorticks="17" minorticks="0" side="0" hidefirst="0" hidelast="0" hideminorticks="0" hide="0" />
</y1axis>
<data>
<stats_month_totalrainfall axisbind="y1axis" legend=" " color1="FF0000FF" color2="FF80FFFF" gradient="vertical" antialiasing="1" filled="1" />
</data>
<legend orientation="0" margin="5" width="765" position-x="300" position-y="90" hide="0" shadow="0">
<font color="FF0000FF" facename="Time new roman" size="18" weight="400" italic="0" />
<border cornerradius="0" color="" thick="1" />
<background color1="" color2="" gradient="1" gradient-direction="90"/>
</legend>
<border cornerradius="0" color="55555555" thick="0" />
<background color1="00000000" stretch="1" />
<graphbackground color1="" color2="" gradient="1" gradient-direction="90" />
</bargraph>
<!-- ================= Cumule sur la période mois================= -->
<textbox width="350" height="25" shadow="0" position-x="160" position-y="95" margin="5" >
<border cornerradius="10" color="55555555" thick="1" />
<text alignement="3">
<line text=" Cumul des précipitations du mois en cours : $Stats[Month,TotalRainfall] $UNIT[Rainfall]"/>
<font color="FF0000FF" facename="Arial" size="15" weight="400" italic="0" />
</text>
<background color1="FFFFFFFF" color2="FF79BCFF" gradient="1" gradient-direction="90" />
</textbox>
<textbox width="470" height="50" position-x="100" position-y="0" >
<text>
<font color="FF0000FF" facename="Time new roman" size="18" weight="400" italic="0" />
<line text=" Rapport généré le $CurrentDate[%A %d %B %Y à %Hh 00]\n"/>
</text>
<background color1="" color2="" gradient="1" gradient-direction="180" stretch="1" />
</textbox>
<textbox width="450" height="50" position-x="180" position-y="20" >
<text>
<font color="FF0000FF" facename="Time new roman" size="15" weight="400" italic="0" />
<line text=" ( Mise à jour des graphiques toutes les heures )"/>
</text>
<background color1="" color2="" gradient="1" gradient-direction="180" stretch="1" />
</textbox>
<!-- ================= annee en cours par mois ================= -->
<bargraph width="675" height="250" shadow="0" position-x="0" position-y="310" margin-top="40" margin-right="70" margin-bottom="50" margin-left="65">
<xaxis color="FF0000FF" grid="1" autoscale="0" min="0" max="0">
<labels labels="Janv.;Fév.;Mars;Avril;Mai;Juin;Juil.;Août;Sep.;Oct.;Nov.;Déc." labelinterval="1" angle="0" side="left" hide="0">
<font color="" facename="Arial" size="14" weight="400" italic="0" />
</labels>
<ticks majorticks="" minorticks="4" side="bottom" hidefirst="0" hidelast="0" hideminorticks="0" hide="0" />
</xaxis>
<y1axis color="FF0000FF" grid="1" autoscale="1" min="0" max="300" y-base="0.0" titleside="left" titlemargin="35">
<title text="Précipitations ( $Unit[Rainfall] )" alignement="vcenter|hcenter" angle="0">
<font color="" facename="Arial" size="16" weight="400" italic="0" />
</title>
<labels labelinterval="1" angle="0" format=".1" side="left" hide="0" >
<font color="FF0000FF" facename="Arial" size="14" weight="400" italic="0" />
</labels>
<ticks majorticks="14" minorticks="1" side="left" hidefirst="0" hidelast="0" hideminorticks="0" hide="0" />
</y1axis>
<data>
<stats_year_totalrainfall axisbind="y1axis" legend=" " color1="FF0000FF" color2="FF80FFFF" gradient="vertical" antialiasing="1" filled="1" />
</data>
<legend orientation="0" margin="3" width="500" position-x="300" position-y="320" hide="0" shadow="0">
<font color="FF0000FF" facename="Time new roman" size="18" weight="400" italic="0" />
<border cornerradius="0" color="" thick="1" />
<background color1="" color2="" gradient="1" gradient-direction="90"/>
</legend>
<graphbackground color1="" color2="" gradient="1" gradient-direction="90" />
</bargraph>
<!-- =================texte barre des mois================= -->
<textbox width="650" height="24" shadow="0" position-x="60" position-y="505" margin="5" >
<border cornerradius="10" color="" thick="1" />
<text alignement="3">
<line text=" Janv Fév Mars Avr Mai Juin Juil Août Sept Oct Nov Déc"/>
<font color="FF0000FF" facename="Arial" size="14" weight="400" italic="0" />
</text>
<background color1="" color2="" gradient="1" gradient-direction="90" />
</textbox>
<!-- ================= Cumule sur la période année================= -->
<textbox width="360" height="25" shadow="0" position-x="160" position-y="315" margin="5" >
<border cornerradius="10" color="55555555" thick="1" />
<text alignement="3">
<line text="Cumul des précipitations sur l'année en cours : $Stats[Year,TotalRainfall] $UNIT[Rainfall]"/>
<font color="FF0000FF" facename="Arial" size="16" weight="400" italic="0" />
</text>
<background color1="FFFFFFFF" color2="FF79BCFF" gradient="1" gradient-direction="90" />
</textbox>
<!-- ================= Cumule depuis 2006================= -->
<textbox width="380" height="25" shadow="0" position-x="160" position-y="530" margin="5" >
<border cornerradius="10" color="55555555" thick="1" />
<text alignement="3">
<line text=" Cumul des précipitations par annnée depuis 2006 ( en mm )"/>
<font color="FF0000FF" facename="Arial" size="16" weight="400" italic="0" />
</text>
<background color1="FFFFFFFF" color2="FF79BCFF" gradient="1" gradient-direction="90" />
</textbox>
<!-- ================= Cumule année en cours ================= -->
<textbox width="60" height="25" shadow="0" position-x="560" position-y="560" margin="5" >
<border cornerradius="0" color="" thick="1" />
<text alignement="3">
<line text="$Stats[Year,TotalRainfall]"/>
<font color="FF0000FF" facename="Arial" size="14" weight="600" italic="0" />
</text>
<background color1="" color2="" gradient="1" gradient-direction="90" />
</textbox>
<!-- =================texte Nota pluie 01================= -->
<textbox width="2500" height="24" shadow="0" position-x="230" position-y="50" margin="5" >
<border cornerradius="10" color="" thick="1" />
<text alignement="3">
<line text="1 mm de pluie = 1 litre par m2"/>
<font color="FF0000FF" facename="Arial" size="14" weight="600" italic="0" />
</text>
<background color1="" color2="" gradient="1" gradient-direction="90" />
</textbox>
<!-- =================texte Nota pluie 02================= -->
<textbox width="545" height="25" shadow="0" position-x="90" position-y="70" margin="5" >
<border cornerradius="10" color="" thick="1" />
<text alignement="3">
<font color="FF0000FF" facename="Arial" size="14" weight="400" italic="0" />
<line text="NOTA : Parfois, le 1 mm de pluie figurant sur le graph, est la cause du brouillard ou de la fonte du givre en hiver"/>
</text>
<background color1="" color2="" gradient="1" gradient-direction="90" />
</textbox>
<!-- ================= Cumule 2006================= -->
<textbox width="50" height="25" shadow="0" position-x="80" position-y="560" margin="5" >
<border cornerradius="10" color="" thick="1" />
<text alignement="3">
<line text="497.0"/>
<font color="FF0000FF" facename="Arial" size="14" weight="400" italic="0" />
</text>
<background color1="" color2="" gradient="1" gradient-direction="90" />
</textbox>
<!-- ================= Cumule 2007================= -->
<textbox width="40" height="25" shadow="0" position-x="138" position-y="560" margin="5" >
<border cornerradius="10" color="" thick="1" />
<text alignement="3">
<line text="420.7"/>
<font color="FF0000FF" facename="Arial" size="14" weight="400" italic="0" />
</text>
<background color1="" color2="" gradient="1" gradient-direction="90" />
</textbox>
<!-- ================= Cumule 2008================= -->
<textbox width="70" height="25" shadow="0" position-x="195" position-y="560" margin="5" >
<border cornerradius="10" color="" thick="1" />
<text alignement="3">
<line text="1019.8"/>
<font color="FF0000FF" facename="Arial" size="14" weight="400" italic="0" />
</text>
<background color1="" color2="" gradient="1" gradient-direction="90" />
</textbox>
<!-- ================= Cumule 2009================= -->
<textbox width="70" height="25" shadow="0" position-x="258" position-y="560" margin="5" >
<border cornerradius="10" color="" thick="1" />
<text alignement="3">
<line text="828.2"/>
<font color="FF0000FF" facename="Arial" size="14" weight="400" italic="0" />
</text>
<background color1="" color2="" gradient="1" gradient-direction="90" />
</textbox>
<!-- ================= Cumule 2010================= -->
<textbox width="70" height="25" shadow="0" position-x="315" position-y="560" margin="5" >
<border cornerradius="10" color="" thick="1" />
<text alignement="3">
<line text="1229.3"/>
<font color="FF0000FF" facename="Arial" size="14" weight="400" italic="0" />
</text>
<background color1="" color2="" gradient="1" gradient-direction="90" />
</textbox>
<!-- ================= Cumule 2011================= -->
<textbox width="70" height="25" shadow="0" position-x="378" position-y="560" margin="5" >
<border cornerradius="10" color="" thick="1" />
<text alignement="3">
<line text="933.0"/>
<font color="FF0000FF" facename="Arial" size="14" weight="400" italic="0" />
</text>
<background color1="" color2="" gradient="1" gradient-direction="90" />
</textbox>
<!-- ================= Cumule 2012================= -->
<textbox width="70" height="25" shadow="0" position-x="438" position-y="560" margin="5" >
<border cornerradius="10" color="" thick="1" />
<text alignement="3">
<line text="875.1"/>
<font color="FF0000FF" facename="Arial" size="14" weight="400" italic="0" />
</text>
<background color1="" color2="" gradient="1" gradient-direction="90" />
</textbox>
<!-- ================= Cumule 2013================= -->
<textbox width="70" height="25" shadow="0" position-x="495" position-y="560" margin="5" >
<border cornerradius="10" color="" thick="1" />
<text alignement="3">
<line text="1023.3"/>
<font color="FF0000FF" facename="Arial" size="14" weight="400" italic="0" />
</text>
<background color1="" color2="" gradient="1" gradient-direction="90" />
</textbox>
</stylesheet>
Bonne manip
Cordialement.