
Bonjour
Tout d'abord félicitation à son créateur pour ce logiciel qui est génial et qui reste "open" pour en modifier les graphismes...
Après avoir déchiffré le langage "xml" ,je me suis amusé pendant quelques mois a re-créer un nouveau graphisme (ideal pour un écran 17" lcd)...et je souhaite vous en faire profiter.
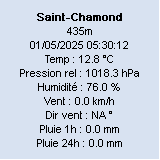
NOTE:le fichier "station" est utilisé pour les données du jour alors que "station date " sert pour la semaine le mois etc
bonne journée
creation interface station meteo
creation interface station meteo
Vous ne pouvez pas consulter les pièces jointes insérées à ce message.
Phil.Z1973
OS:WINDOWS-10/64bit
Station Météo:OREGON Scientifique-WRM200
Logiciel:CUMULUS V1.9.4/GraphWeather V3.0.15
OS:WINDOWS-10/64bit
Station Météo:OREGON Scientifique-WRM200
Logiciel:CUMULUS V1.9.4/GraphWeather V3.0.15
-
Micharnaud
- Membre
- Messages : 787
- Inscription : mer. déc. 22, 2010 1:36 pm
- Localisation : Ariege
- Contact :
Re: creation interface station meteo
tres bon boulot je prend merci a toi
-
laulau

- Membre
- Messages : 405
- Inscription : mar. mars 03, 2009 8:39 pm
- Localisation : 42400
- Contact :
Re: creation interface station meteo
Salut
Beau travail, merci.
Laurent
Beau travail, merci.
Laurent
Vantage-Vue  WeatherLink 6.0.3 / Graphweather V3.0.35 avec plugin VantagePro / Cumulus 1.9.4 /Win 10
http://www.st-chamond-meteo.fr

http://www.st-chamond-meteo.fr
-
paaubert

- Membre
- Messages : 2624
- Inscription : dim. janv. 17, 2010 7:16 pm
- Localisation : 1555 Villarzel - Switzerland
- Contact :
Re: creation interface station meteo
Salut,
Joli style, merci pour le partage.
A+
Joli style, merci pour le partage.
A+
_________________________________________________________________________________________________________
Station Vantage Pro2+ avec station agricole - Weatherlink 6.0.3 - GraphWeather 3.0.15b - Cumulus 1.9.4 - Windows W10 ultimate x64
http://www.boock.ch/meteo-villarzel.php

Station Vantage Pro2+ avec station agricole - Weatherlink 6.0.3 - GraphWeather 3.0.15b - Cumulus 1.9.4 - Windows W10 ultimate x64
http://www.boock.ch/meteo-villarzel.php
-
Philippe
- Membre
- Messages : 27
- Inscription : dim. janv. 16, 2011 10:46 pm
- Localisation : Versoix - Suisse
- Contact :
Re: creation interface station meteo
très joli, bravo ! (et merci pour le partage) !
Station Vantage Pro 2 - WeatherLink 5.9.2 - GraphWeather V2.0.321 - Windows Seven
http://www.meteoversoix.com

http://www.meteoversoix.com
Re: creation interface station meteo
Very nice !!!!!!!!!!!!!
-
MAGNUS

- Membre
- Messages : 992
- Inscription : dim. mars 26, 2006 4:44 pm
- Localisation : VIDAUBAN (83) FRANCE
- Contact :
Re: creation interface station meteo
Bonjour,
Beau travail, merci de nous en faire profiter.
Cordialement.
Beau travail, merci de nous en faire profiter.
Cordialement.
Station WMR 200 avec XNet_meteo V 2014-10-29a Logiciels:Graphweather V 3.0.16, Noaa Template2, Windows 7
Mon abri météo ici :http://www.vardecouverte.fr/sta%20bc2008.htm
Site Web : http://www.vardecouverte.fr
Mon abri météo ici :http://www.vardecouverte.fr/sta%20bc2008.htm
Site Web : http://www.vardecouverte.fr
-
jturlier

- Membre
- Messages : 3150
- Inscription : mar. août 22, 2006 8:38 am
- Localisation : 34410 Sérignan - Languedoc
- Contact :
Re: creation interface station meteo
Bonjour,
cette feuille de style m'a beaucoup plu et je me suis permis d'y apporter quelques modifications sur la taille et l'alignement des différents graphiques ainsi que sur la rose des vents.
En espérant que cela suscitera quelques vocations de développeurs.
Jean
cette feuille de style m'a beaucoup plu et je me suis permis d'y apporter quelques modifications sur la taille et l'alignement des différents graphiques ainsi que sur la rose des vents.
En espérant que cela suscitera quelques vocations de développeurs.
Jean
Code : Tout sélectionner
<?xml version="1.0" encoding="iso-8859-1" ?>
<stylesheet>
	<image width="1000" height="780" />
<!--   ================= Background =================

  -->
  -
- <frame width="1000" height="780" position-x="0" position-y="0">
	<background color="FF000000"  />
	<!--<border cornerradius="0" color="FF000000" thick="1" /> inutile fond noir border noir-->
  </frame>

<!-- ================= Statistics ================= -->

	<textbox width="300" height="40" shadow="0" position-x="350" position-y="0" margin="5" >
		<text alignement="left|top">
			<line text="[_$CurrentDate[%A %d %B %Y à %Hh%M]_]"/>
			<font color="FFC0C0C0" facename="Arial" size="16" weight="800" italic="1" />
		</text>
	</textbox>

<!-- ================= frames autour des graphiques ================= -->

   <frame width="715" height="140" position-x="270" position-y="30">
  <background color="00000000" />
  <border cornerradius="5" color="FFffffff" thick=".5" />
  </frame>
   <frame width="715" height="140" position-x="270" position-y="180">
  <background color="00000000" />
  <border cornerradius="5" color="FFffffff" thick=".5" />
  </frame>
   <frame width="715" height="140" position-x="270" position-y="330">
  <background color="00000000" />
  <border cornerradius="5" color="FFffffff" thick=".5" />
  </frame>
   <frame width="715" height="140" position-x="270" position-y="480">
  <background color="00000000" />
  <border cornerradius="5" color="FFffffff" thick=".5" />
  </frame>
   <frame width="715" height="140" position-x="270" position-y="630">
  <background color="00000000" />
  <border cornerradius="5" color="FFffffff" thick=".5" />
  </frame>

	 <!--  ================= Temperature ,point de rosee humidite ================= -->
	 <!--  ================= Temperature ,point de rosee humidite ================= -->

- <lineplot width="800" height="150" shadow="0" position-x="260" position-y="10" margin-top="33" margin-right="280" margin-bottom="10" margin-left="65">

 - 	<xaxis color="FFC0C0C0" grid="0" autoscale="0" titleside="bottom">
- 		<labels labelinterval="1" angle="0" format="%Hh%M" side="left" hide="0">
			<font color="FFC0C0C0" facename="Arial" size="12" weight="400" italic="1" />
		</labels>
		<ticks majorticks="7" minorticks="4" side="bottom" />
	</xaxis>

- 	<y1axis color="FFFF0000" grid="1" autoscale="1" min="0" max="0" titleside="left" titlemargin="30">
-		<title text="Température ($Unit[Temperature])" alignement="vcenter|hcenter" angle="0">
			<font color="FFFF0000" facename="Arial" size="12" weight="600" italic="1" />
		</title>
- 		<labels format=".0" side="left">
			<font color="FFFF0000" facename="Arial" size="12" weight="400" italic="1" />
		</labels>
		<ticks majorticks="5" minorticks="4" side="left" />
	</y1axis>

	<y2axis ydelta="70" side="right" color="FF00BB33" grid="0" autoscale="0" min="0" max="100" titleside="right" titlemargin="30">
		<title text="Humidité (%)" alignement="vcenter|hcenter" angle="0">
			<font color="FF00BB33" facename="Arial" size="12" weight="600" italic="1" />
		</title>
		<labels labelinterval="1" angle="0" format=".0" side="right" hide="0">
			<font color="FF00BB33" facename="Arial" size="12" weight="400" italic="1" />
		</labels>
		<ticks autoticks="0" majorticks="5" minorticks="4" side="right" hidefirst="0" hidelast="0" hideminorticks="0" hide="0" />
	</y2axis>

- 	<legend position-x="830" position-y="20" hide="0" shadow="0">
		<font color="FFC0C0C0" facename="Arial" size="12" weight="800" italic="1" />
		<background color="00FFFFFF" />
	</legend>

-	<data>
		<wind_chill axisbind="y1axis" legend="Facteur vent" color1="FF0000FF" color2="FFC0C0C0" antialiasing="1" filled="0" hide="0" thick="1.2" pattern="CCCCCCCC" />
		<outdoor_temperature axisbind="y1axis" legend="Température ext" color1="FFFF0000" color2="FFC0C0C0" antialiasing="1" filled="0" hide="0" thick="2" />
		<threshold axisbind="y1axis" legend="0°" color1="FF0000FF" value="0" thick="1.0"/>
		<dew_point axisbind="y1axis" legend="Point de rosée" color1="FF00C4FF" color2="FF0000FF" antialiasing="1" filled="0" hide="0" thick="1.2"/>
		<outdoor_humidity axisbind="y2axis" legend="Humidité extérieure" color1="5000FF00" color2="500000FF" antialiasing="1" filled="1" hide="0" />
		<outdoor_humidity axisbind="y2axis" color1="300000FF" antialiasing="1" hidelegend="1" thick="1.2"/>
	</data>
  </lineplot>

<!-- ================= gaugeOutdoor Temperature ================= -->

	<lineargauge width="130" height="200" shadow="0" orientation="1" position-x="0" position-y="20" margin-top="26" margin-right="9" margin-bottom="50" margin-left="11" >
		<title text="$Current[outdoor_temperature] $Unit[Temperature]" alignement="relative" angle="0" position-x="0.47" position-y="0.86">
			<font color="FFFF0000" facename="Arial" size="18" weight="800" italic="1" />
		</title>
		<axis color="FFC0C0C0"  min="-5" max="35" side="hcenter" titlemargin="20">                      REGLAGE PLAGE TEMPERATURE
			<title text="Température" alignement="vcenter|hcenter" angle="180">
				<font color="FFFF0000" facename="Arial" size="12" weight="800" italic="1" />
			</title>
			<labels labelinterval="1" side="left" hide="0">
				<font color="FFC0C0C0" facename="Arial" size="12" weight="400" italic="1" />
			</labels>
			<ticks majorticks="9" minorticks="4" side="left" hidefirst="0" hidelast="0" hideminorticks="0" hide="0" minorticksize="5" majorticksize="9"/>
		</axis>
		<index>
			<current_outdoor_temperature color1="FF0000FF" color2="FFFF0000" filled="1" side="left" thick="9" axisdelta="0"/>
			<stats_day_max_outdoor_temperature texture="temp_max.png"  side="left" thick="9" axisdelta="0"/>
			<stats_day_min_outdoor_temperature texture="temp_mini.png"  side="left" thick="9" axisdelta="0"/>
		</index>
	</lineargauge>

<!-- ================= gauge Outdoor rose ================= -->

	<lineargauge width="130" height="200" shadow="0" orientation="1" position-x="80" position-y="20" margin-top="26" margin-right="9" margin-bottom="50" margin-left="11" >
		<title text="$Current[dew_point] $Unit[Temperature]" alignement="relative" angle="0" position-x="0.47" position-y="0.86">
			<font color="FF00C4FF" facename="Arial" size="18" weight="800" italic="1" />
		</title>
		<axis color="FFC0C0C0" min="-15" max="20" side="hcenter" titlemargin="20">                        REGLAGE PLAGE TEMPERATURE
			<title text="Point de rosée" alignement="vcenter|hcenter" angle="180">
				<font color="FF00C4FF" facename="Arial" size="12" weight="800" italic="1" />
			</title>
			<labels labelinterval="1" side="left" hide="0">
				<font color="FFC0C0C0" facename="Arial" size="12" weight="400" italic="1" />
			</labels>
			<ticks majorticks="8" minorticks="4" side="left" hidefirst="0" hidelast="0" hideminorticks="0" hide="0" minorticksize="5" majorticksize="9"/>
		</axis>
		<index>
			<current_dew_point color1="FF0000FF" color2="FF00C4FF" filled="1" side="left" thick="9" axisdelta="0"/>
			<stats_day_max_dew_point texture="temp_max.png"  side="left" thick="9" axisdelta="0"/>
			<stats_day_min_dew_point texture="temp_mini.png"  side="left" thick="9" axisdelta="0"/>
		</index>
	</lineargauge>

<!-- ================= gaugeOutdoor humidite ================= -->

	<lineargauge width="130" height="200" shadow="0" orientation="1" position-x="160" position-y="20" margin-top="26" margin-right="9" margin-bottom="50" margin-left="11" >
		<title text="$Current[outdoor_humidity] $Unit[outdoor_humidity] %" alignement="relative" angle="0" position-x="0.47" position-y="0.86">
			<font color="FF00BB33" facename="Arial" size="18" weight="800" italic="1" />
		</title>
		<axis color="FFC0C0C0" min="0" max="100" side="hcenter" titlemargin="20">
			<title text="Humidité" alignement="vcenter|hcenter" angle="180">
				<font color="FF00BB33" facename="Arial" size="12" weight="800" italic="1" />
			</title>
			<labels labelinterval="1" side="left" hide="0">
				<font color="FFC0C0C0" facename="Arial" size="12" weight="400" italic="1" />
			</labels>
			<ticks majorticks="6" minorticks="4" side="left" hidefirst="0" hidelast="0" hideminorticks="0" hide="0" minorticksize="5" majorticksize="9"/>
		</axis>
		<index>
			<current_outdoor_humidity color1="ff00FF00" color2="ff0000FF" filled="1" side="left" thick="9" axisdelta="0"/>
			<stats_day_max_outdoor_humidity texture="humidite_max.png"   side="left" thick="9" axisdelta="0"/>
			<stats_day_min_outdoor_humidity texture="humidite_mini.png"  side="left" thick="9" axisdelta="0"/>
		</index>
	</lineargauge>

 <!--  ================= pression =================   -->
 <!--  ================= pression =================   -->

- 	<lineplot width="800" height="200" shadow="0" position-x="260" position-y="165" margin-top="23" margin-right="280" margin-bottom="67" margin-left="65">
		<xaxis color="FFC0C0C0" grid="0" autoscale="0" min="0" max="0" titleside="bottom">
- 			<labels labelinterval="1" angle="0" format="%Hh%M" side="left" hide="0">
				<font color="FFC0C0C0" facename="Arial" size="12" weight="400" italic="1" />
			</labels>
			<ticks majorticks="7" minorticks="4" side="bottom" hidefirst="0" hidelast="0" hideminorticks="0" hide="0" />
		</xaxis>
- 		<y1axis side="left" color="FF00BB33" grid="1" autoscale="1" titleside="left" titlemargin="30">
- 			<title text="Pression ($Unit[Pressure])" alignement="vcenter|hcenter" angle="0">
				<font color="FF00BB33" facename="Arial" size="12" weight="600" italic="1" />
			</title>
- 			<labels labelinterval="1" angle="0" format=".0" side="left" hide="0">
				<font color="FF00BB33" facename="Arial" size="12" weight="400" italic="1" />
			</labels>
			<ticks majorticks="5" minorticks="4" side="right" hidefirst="0" hidelast="0" hideminorticks="0" hide="0" />
		</y1axis>
- 		<legend position-x="830" position-y="175" hide="0" shadow="0">
			<font color="FFC0C0C0" facename="Arial" size="12" weight="800" italic="1" />
		</legend>
  		<data>
			<relative_pressure axisbind="y1axis" legend="Pression " color1="45009000" color2="4500FF00" antialiasing="1" filled="1" hide="0" thick="1.2" />
			<threshold axisbind="y1axis" legend="anticyclone \n depression 1015 hPa" color1="FF008CFF" value="1015" thick="1.0"/>
		</data>
	</lineplot>

<!-- ================= gaugeRelative Pressure ================= -->

	<circulargauge width="200" height="200" shadow="0" orientation="1" position-x="-20" position-y="190" margin-top="50" margin-right="50" margin-bottom="50" margin-left="50" >
		<title text="Pression \n$Current[relative_pressure,6.1] $Unit[Pressure]" alignement="relative" angle="0" position-x="0.5" position-y="0.8">
			<font color="FF00C600" facename="Arial" size="12" weight="800" italic="1" />
		</title>
		<axis color="FF72B8FF" min="965" max="1065" titlemargin="50" titleside="top" fromangle="-45" toangle="225">
			<labels labelinterval="1" side="0" hide="0">
				<font color="FF72B8FF" facename="Arial" size="12" weight="400" italic="0" />
			</labels>
			<ticks majorticks="7" minorticks="3" side="left" hidefirst="0" hidelast="0" hideminorticks="0" hide="0" minorticksize="5" majorticksize="9"/>
		</axis>
		<index>
			<current_relative_pressure color1="FFFF0000" color2="FF00FF00" filled="1"  texture="PRESSION.png" side="left" thick="9" axisdelta="0"/>
			<stats_day_min_relative_pressure color1="FFFF0000" color2="FF00FF00" texture="pression_min.png"  side="left" thick="9" axisdelta="0"/>
			<stats_day_max_relative_pressure color1="FFFF0000" color2="FF00FF00" texture="pression_max.png"  side="left" thick="9" axisdelta="0"/>
		</index>
	</circulargauge>

<!-- ================= Icon ================= -->

	<frame width="80" height="80" position-x="170" position-y="260">
		<background color="ff0000ff" texture="$WeatherForecast[Icon]" stretch="1" />
	</frame>

<!--  =================vitesse vent=================   -->

-	<lineplot width="800" height="200" shadow="0" position-x="260" position-y="315" margin-top="23" margin-right="280" margin-bottom="67" margin-left="65">
-		<xaxis color="FFC0C0C0" grid="0" autoscale="0" min="0" max="0">
- 			<labels labelinterval="1" angle="0" format="%Hh%M" side="left" hide="0">
				<font color="FFC0C0C0" facename="Arial" size="12" weight="400" italic="1" />
			</labels>
			<ticks majorticks="7" minorticks="4" side="bottom" hidefirst="0" hidelast="0" hideminorticks="0" hide="0" />
		</xaxis>
- 		<y1axis color="FFFF0000" grid="1" autoscale="1" min="0" max="0" titleside="top" titlemargin="30">
- 			<title text="Vitesse du vent ($Unit[Speed])" alignement="vcenter|hcenter" angle="0">
				<font color="FFFF0000" facename="Arial" size="12" weight="600" italic="1" />
			</title>
- 			<labels labelinterval="1" angle="0" format=".0" side="left" hide="0">
				<font color="FFFF0000" facename="Arial" size="12" weight="400" italic="1" />
			</labels>
		<ticks majorticks="5" minorticks="4" side="left" hidefirst="0" hidelast="0" hideminorticks="0" hide="0" />
		</y1axis>
- 		<y2axis side="right" color="FF72B8FF" grid="1" autoscale="0" min="0" max="360" titleside="right" titlemargin="40">
- 			<title text="Direction du vent ( ° )" alignement="vcenter|hcenter" angle="0">
				<font color="FF72B8FF" facename="Arial" size="12" weight="600" italic="1" />
			</title>
- 			<labels labelinterval="1" angle="0" format=".0" side="right" hide="0">
				<font color="FF72B8FF" facename="Arial" size="12" weight="400" italic="1" />
			</labels>
			<ticks majorticks="5" minorticks="4" side="right" hidefirst="0" hidelast="0" hideminorticks="0" hide="0" />
		</y2axis>
- 		<legend position-x="830" position-y="320" hide="0" shadow="0">
			<font color="FFC0C0C0" facename="Arial" size="12" weight="800" italic="1" />
		</legend>

- 		<data>
			<wind_speed axisbind="y1axis" legend="Vitesse du vent max" color1="66FF0000" color2="33FF0000" antialiasing="1" filled="1" />
			<wind_speed axisbind="y1axis" legend="Vitesse du vent" color1="66FF0000" antialiasing="1" filled="0" hidelegend="1" thick="1.2" />
			<wind_gust axisbind="y1axis" legend="Rafales" color1="FF800080" antialiasing="1" filled="0" hidelegend="0" thick="1.2" />
			<wind_direction axisbind="y2axis" legend="Direction du vent" color1="FF72B8FF" antialiasing="1" filled="0" hidelegend="0" thick="3" pattern="00000000" />
		</data>
	</lineplot>

	<!-- ================= gaugeWind speed ================= -->


	<circulargauge width="260" height="260" shadow="0" orientation="1" position-x="-50" position-y="325" margin-top="70" margin-right="70" margin-bottom="70" margin-left="70" >
		<title text="Vitesse vent \n$Current[wind_speed] $Unit[Speed]" alignement="relative" angle="0" position-x="0.5" position-y="0.73">
			<font color="FFFF0000" facename="Arial" size="12" weight="800" italic="1" />
		</title>
		<axis color="FF72B8FF" min="0" max="130" titlemargin="50" titleside="bottom" fromangle="0" toangle="225">
			<labels labelinterval="1" side="160" hide="0">
				<font color="FF72B8FF" facename="Arial" size="12" weight="400" italic="1" />
			</labels>
			<ticks majorticks="7" minorticks="2" side="bottom" hidefirst="0" hidelast="0" hideminorticks="0" hide="0" minorticksize="5" majorticksize="9"/>
		</axis>
		<index>
			<current_wind_speed color1="FFFF0000" color2="FF00FF00" filled="1"  texture="vitessevent.png" side="left" thick="9" axisdelta="0"/>
			<stats_day_max_wind_speed texture="vent_max.png"  side="left" thick="9" axisdelta="0"/>
 		</index>
	</circulargauge>

<!-- ================= Wind direction ================= -->
		<!-- ================= Radarplot ================= -->
	<radarplot width="190" height="190" shadow="0" orientation="1" position-x="110" position-y="355" margin-top="45" margin-right="45" margin-bottom="45" margin-left="45" >
		<axis color="0088BB88" grid="0" autoscale="1" min="0" max="0">
			<ticks autoticks="0" majorticks="0" minorticks="0" side="bottom" hidefirst="0" hidelast="0" hideminorticks="0" hide="1" />
		</axis>
		<data>
			<wind_direction legend="" color1="AAFF0000" color2="FF72B8FF" antialiasing="1" filled="1" />
			<wind_direction legend="" color1="AAFF0000" antialiasing="1" hidelegend="1" thick="1.2" />
		</data>
	</radarplot>

		<!-- =================gauge Wind direction ================= -->
	<circulargauge width="190" height="190" shadow="0" orientation="1" position-x="110" position-y="355" margin-top="45" margin-right="45" margin-bottom="45" margin-left="45" >
		<title text="Direction Vent \n$Current[wind_direction,f1]" alignement="relative" angle="0" position-x="0.52" position-y="0.9">
			<font color="FF72B8FF" facename="Arial" size="12" weight="800" italic="1" />
		</title>
		<axis color="FF72B8FF" min="0" max="360" titlemargin="20" titleside="bottom" fromangle="90" toangle="450">
			<labels labels="N;NO;O;SO;S;SE;E;NE" labelinterval="1" side="top" hide="0">
				<font color="FF72B8FF" facename="Arial" size="12" weight="800" italic="0" />
			</labels>
			<ticks majorticks="9" minorticks="3" side="bottom" hidefirst="0" hidelast="0" hideminorticks="0" hide="0" minorticksize="5" majorticksize="9"/>
		</axis>
		<index>
			<current_wind_direction color1="FFFF0000" color2="FF00FF00" filled="1"  texture="directionvent.png" side="left" thick="9" axisdelta="0"/>
		</index>
	</circulargauge>

<!--  ================= precipitation =================  -->
<!--  ================= precipitation =================  -->

	<lineplot width="800" height="200" shadow="0" position-x="260" position-y="465" margin-top="23" margin-right="280" margin-bottom="67" margin-left="65">
- 		<xaxis color="FFC0C0C0" grid="0" autoscale="0" min="0" max="0">
- 			<labels labelinterval="1" angle="0" format="%Hh%M" side="left" hide="0">
				<font color="FFC0C0C0" facename="Arial" size="12" weight="400" italic="1" />
			</labels>
			<ticks majorticks="7" minorticks="4" side="bottom" hidefirst="0" hidelast="0" hideminorticks="0" hide="0" />
		</xaxis>
- 		<y1axis side="left" color="FF72B8FF" grid="1" autoscale="1" min="0" max="300" titleside="left" titlemargin="35">
- 			<title text="Précipitations ($Unit[Rainfall])" alignement="vcenter|hcenter" angle="0">
				<font color="FF72B8FF" facename="Arial" size="12" weight="600" italic="1" />
			</title>
- 			<labels labelinterval="1" angle="0" format=".1" side="left" hide="0">
				<font color="FF72B8FF" facename="Arial" size="12" weight="400" italic="1" />
			</labels>
			<ticks majorticks="5" minorticks="4" side="left" hidefirst="0" hidelast="0" hideminorticks="0" hide="0" />
		</y1axis>
- 		<y2axis side="right" color="FF00C4FF" grid="0" autoscale="1" min="0" max="300" titleside="right" titlemargin="35" ydelta="55">
- 			<title text="Pluie 24h ($Unit[Rainfall])" alignement="vcenter|hcenter" angle="0">
				<font color="FF00C4FF" facename="Arial" size="12" weight="600" italic="1" />
			</title>
- 			<labels labelinterval="1" angle="0" format=".1" side="right" hide="0">
				<font color="FF00C4FF" facename="Arial" size="12" weight="400" italic="1" />
			</labels>
			<ticks majorticks="5" minorticks="4" side="right" hidefirst="0" hidelast="0" hideminorticks="0" hide="0" />
		</y2axis>
- 		<legend position-x="830" position-y="470" hide="0" shadow="0">
			<font color="FFC0C0C0" facename="Arial" size="12" weight="800" italic="1" />
		</legend>
		<data>
			<relative_rainfall axisbind="y1axis" legend="Précipitations" color1="FF72B8FF" color2="FF72B8FF" antialiasing="1" filled="1" />
			<relative_rainfall axisbind="y1axis" legend="Précipitations" color1="FF72B8FF" antialiasing="1" filled="0" hidelegend="1" thick="1.2" />
			<rainfall_24h axisbind="y2axis" legend="Précipitations 24h"  color1="5000C4FF" color2="500000FF" antialiasing="1" filled="1" hidelegend="0" thick="1.2" />
		</data>
	</lineplot>

<!-- ================= pluie annee ================= -->
<!-- ================= pluie annee ================= -->

	<bargraph width="800" height="200" shadow="0" position-x="260" position-y="615" margin-top="23" margin-right="280" margin-bottom="67" margin-left="65">
		<xaxis color="FFC0C0C0" >
			<labels labelinterval="1" labels="Janv.;Fév.;Mars;Avril;Mai;Juin;Juil.;Août;Sep.;Oct.;Nov.;Déc." angle="0"  side="left" hide="0">
				<font color="FFC0C0C0" facename="Arial" size="12" weight="400" italic="1" />
			</labels>
			<ticks majorticks="7" minorticks="4" side="bottom" hidefirst="0" hidelast="0" hideminorticks="0" hide="0" />
		</xaxis>
		<y1axis color="ff004FFF" grid="1" autoscale="1" min="0" max="0" titleside="top" titlemargin="35">
			<title text=" Annuelle ( $Unit[Rainfall] )" alignement="vcenter|hcenter" angle="0">
				<font color="ff004FFF" facename="Arial" size="12" weight="600" italic="1" />
			</title>
			<labels labelinterval="1" angle="0" format=".0" side="left" hide="0" >
				<font color="ff004FFF" facename="Arial" size="12" weight="400" italic="1" />
			</labels>
			<ticks majorticks="5" minorticks="4" side="left" hidefirst="0" hidelast="0" hideminorticks="0" hide="0" />
		</y1axis>
		<y2axis color="ff004FFF" grid="1" side="right" autoscale="1" min="0" max="0" titleside="top" titlemargin="35">
			<labels  hide="1" >
			</labels>
			<ticks hide="1" />
		</y2axis>
		<data>
			<stats_2011_totalrainfall axisbind="y1axis" legend="Précipitations\nannuelle" color1="8000C4FF" color2="800000FF" antialiasing="1" filled="1" />
		</data>
		<legend orientation="0" width="665" position-x="830" position-y="626" hide="0" shadow="0">
			<font color="FFC0C0C0" facename="Arial" size="12" weight="800" italic="1" />
		</legend>
	</bargraph>

	<!-- ================= gauge Absolute rainfall ================= -->

	<lineargauge width="20" height="200" shadow="0" orientation="1" position-x="30" position-y="535" margin-top="40" margin-right="0" margin-bottom="42" margin-left="0" >
		<title text="Annuelle:\n$Stats[Year,TotalRainfall] $Unit[Rainfall]" alignement="relative" angle="0" position-x="0.90" position-y="0.88">
			<font color="FFC0C0C0" facename="Arial" size="12" weight="800" italic="1" />
		</title>
		<axis color="FFC0C0C0" min="0" max="1000" side="left" titlemargin="30" titleside="left">
			<labels labelinterval="1" side="right" hide="0">
				<font color="FFC0C0C0" facename="Arial" size="12" weight="400" italic="0" />
			</labels>
			<ticks majorticks="6" minorticks="3" side="right" hidefirst="0" hidelast="0" hideminorticks="0" hide="0" minorticksize="18" majorticksize="25"/>
		</axis>
		<index>
			<stats_year_totalrainfall color1="FF00008F" color2="FF00008F" filled="1" reverse="0" side="right" thick="25" axisdelta="0"/>
		</index>
	</lineargauge>

	<!-- ================= gauge rainfall 24h ================= -->

	<lineargauge width="20" height="200" shadow="0" orientation="1" position-x="110" position-y="535" margin-top="40" margin-right="0" margin-bottom="42" margin-left="0" >
		<title text="Sur 24h :\n$Current[rainfall_24h] $Unit[Rainfall]" alignement="relative" angle="0" position-x="0.90" position-y="0.88">
			<font color="FFC0C0C0" facename="Arial" size="12" weight="800" italic="1" />
		</title>
		<axis color="FFC0C0C0" min="0" max="80" side="left" titlemargin="30" titleside="left">
			<labels labelinterval="1" side="right" hide="0">
				<font color="FFC0C0C0" facename="Arial" size="12" weight="400" italic="0" />
			</labels>
			<ticks majorticks="6" minorticks="3" side="right" hidefirst="0" hidelast="0" hideminorticks="0" hide="0" minorticksize="18" majorticksize="25"/>
		</axis>
		<index>
			<current_rainfall_24h color1="FF00008F" color2="FF00008F"  filled="1" reverse="0" side="right" thick="25" axisdelta="0"/>
		</index>
	</lineargauge>

	<!-- =================gauge rainfall 1h ================= -->

	<lineargauge width="20" height="200" shadow="0" orientation="1" position-x="194" position-y="535" margin-top="40" margin-right="0" margin-bottom="42" margin-left="0" >
		<title text="Sur 1h :\n$Current[rainfall_1h] $Unit[Rainfall]" alignement="relative" angle="0" position-x="0.9" position-y="0.88">
			<font color="FFC0C0C0" facename="Arial" size="12" weight="800" italic="1" />
		</title>
		<axis color="FFC0C0C0" min="0" max="30" side="left" titlemargin="30" titleside="left">
			<labels labelinterval="1" side="right" hide="0">
				<font color="FFC0C0C0" facename="Arial" size="12" weight="400" italic="0" />
			</labels>
			<ticks majorticks="5" minorticks="3" side="right" hidefirst="0" hidelast="0" hideminorticks="0" hide="0" minorticksize="18" majorticksize="25"/>
		</axis>
		<index>
			<current_rainfall_1h color1="FF00008F" color2="FF00008F" filled="1" reverse="0" side="right" thick="25" axisdelta="0"/>
		</index>
	</lineargauge>
</stylesheet>
Vous ne pouvez pas consulter les pièces jointes insérées à ce message.
-
laulau
- Membre
- Messages : 405
- Inscription : mar. mars 03, 2009 8:39 pm
- Localisation : 42400
- Contact :
Re: creation interface station meteo
Merci Jean, je viens de la mettre sur mon site.Bonjour,
cette feuille de style m'a beaucoup plu et je me suis permis d'y apporter quelques modifications sur la taille et l'alignement des différents graphiques ainsi que sur la rose des vents.
En espérant que cela suscitera quelques vocations de développeurs.
Jean
Laurent
Vantage-Vue WeatherLink 6.0.3 / Graphweather V3.0.35 avec plugin VantagePro / Cumulus 1.9.4 /Win 10
http://www.st-chamond-meteo.fr
http://www.st-chamond-meteo.fr
Re: creation interface station meteo
Bonjour,
J'ai téléchargé le fichier ZIP , je l'ai décompressé , je lis le fichier XML dans GW , mais je n'arrive pas à installer le reste du fichier ZIP : les flèches , curseurs et autres dans GW !
Merci d'aider un ignorant en informatique !
Geyser
J'ai téléchargé le fichier ZIP , je l'ai décompressé , je lis le fichier XML dans GW , mais je n'arrive pas à installer le reste du fichier ZIP : les flèches , curseurs et autres dans GW !
Merci d'aider un ignorant en informatique !
Geyser
-
paaubert
- Membre
- Messages : 2624
- Inscription : dim. janv. 17, 2010 7:16 pm
- Localisation : 1555 Villarzel - Switzerland
- Contact :
Re: creation interface station meteo
le mieux, c'est de décompresser toute l'archive dans un même répertoire, crée par exemple un sous répertoire "interface" dans Stylesheets et tu mets tout les fichiers du zip dedans.
A+
A+
_________________________________________________________________________________________________________
Station Vantage Pro2+ avec station agricole - Weatherlink 6.0.3 - GraphWeather 3.0.15b - Cumulus 1.9.4 - Windows W10 ultimate x64
http://www.boock.ch/meteo-villarzel.php
Station Vantage Pro2+ avec station agricole - Weatherlink 6.0.3 - GraphWeather 3.0.15b - Cumulus 1.9.4 - Windows W10 ultimate x64
http://www.boock.ch/meteo-villarzel.php
Re: creation interface station meteo
Ca marche !
Merci!
Geyser
Merci!
Geyser
-
ardigier

- Membre
- Messages : 2260
- Inscription : mar. mars 23, 2010 6:05 pm
- Localisation : Le Thor 84250
- Contact :
Re: creation interface station meteo
Merci à Zara pour son stylesheet,je l'ai un peu mofifié (avec l'aide Jean)
cidessous le rendu et le zip du fichier
cidessous le rendu et le zip du fichier
Dernière modification par ardigier le mer. nov. 23, 2011 10:39 am, modifié 1 fois.
WMR200 - XNet meteo 2011-10-14a- graphweather V 3.0.35- Win10 x64
webcam installée orientation NE
http://le-thor-meteo.com/index.php
webcam installée orientation NE
http://le-thor-meteo.com/index.php
-
iceman62

- Membre
- Messages : 176
- Inscription : mar. avr. 12, 2011 10:14 am
- Localisation : Achiet-le-grand
- Contact :
Re: creation interface station meteo
Bravo Pierre-André pour cette belle réalisation et merci Jean pour les améliorations
Davis VP2 6152EU en fonction => 1 panne en 6 ans.....
Cumulus+ data logger
Cumulus2sql, Sql2sql, WU update
Graphweather 3.0.27 RAS
La Crosse WS-2801 => grosse daube! 2 pluvio hs et 1 transmetteur en rideau. démontée!
La Crosse WS-2350 => HS grosse daube poubelle!!!
W7 ultimate x64
Proc 3Ghz, 6 Go de mémoire
http://www.meteo-achiet.infos.st/index.php
Cumulus+ data logger
Cumulus2sql, Sql2sql, WU update
Graphweather 3.0.27 RAS
La Crosse WS-2801 => grosse daube! 2 pluvio hs et 1 transmetteur en rideau. démontée!
La Crosse WS-2350 => HS grosse daube poubelle!!!
W7 ultimate x64
Proc 3Ghz, 6 Go de mémoire
http://www.meteo-achiet.infos.st/index.php
-
domidom81

- Membre
- Messages : 477
- Inscription : mer. févr. 18, 2009 1:34 pm
- Localisation : Lagarrigue 81 (Tarn France)
- Contact :
Re: creation interface station meteo
Bonjour,
Également, merci beaucoup à Zara pour le graph "tableau de bord"  , et les "têtes chercheuses" de ce forum pour au final une belle feuille de style.
Merci pour le partage!!
a+
Également,
Merci pour le partage!!
a+
Vous ne pouvez pas consulter les pièces jointes insérées à ce message.
Station VP2-IP + WebCam sur IC Lagarrigue81 Weatherlink 6555 (V 6.0.2)
Site Station VantagePro2+WebCam Foscam FI9805W (GW V3.0.15) Win10x64 Pc HP

Site Station VantagePro2+WebCam Foscam FI9805W (GW V3.0.15) Win10x64 Pc HP