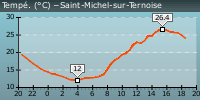
Alors pour les températures :

Ca donne cela :
Code : Tout sélectionner
<?xml version="1.0" encoding="iso-8859-1" ?>
<stylesheet>
  <image width="250" height="190" />
  <frame width="250" height="190" position-x="0" position-y="0" shadow="0">
    <title text="" alignement="left|top" angle="0">
      <font color="FF000000" facename="Arial" size="14" weight="400" italic="0" />
    </title>
    <background color1="FFBBBBFF" color2="FFFFFFFF" gradient="1" gradient-direction="135" stretch="1" />
    <border cornerradius="0" color="55555555" thick="1" />
  </frame>
	<!-- ================= First Lineplot =================  -->
  	<lineplot width="230" height="120" shadow="0" position-x="10" position-y="10" margin-top="10" margin-right="10" margin-bottom="10" margin-left="10">
		<xaxis color="FF000000" grid="1" autoscale="0" min="0" max="0">
			<title text="" alignement="vcenter|hcenter" angle="0">
				<font color="FF000000" facename="Arial" size="12" weight="400" italic="1" />
			</title>
			<labels labelinterval="1" angle="0"  side="left" hide="0">
				<font color="FF000000" facename="Arial" size="12" weight="400" italic="1" />
			</labels>
			<ticks majorticks="7" minorticks="4" side="bottom" hidefirst="0" hidelast="0" hideminorticks="0" hide="0" />
		</xaxis>
		<y1axis color="FF000000" grid="1" autoscale="1"  min="0" max="0" titleside="top" titlemargin="35">
			<title text="Température ($Unit[Temperature])" alignement="vcenter|hcenter" angle="0">
				<font color="FF000000" facename="Arial" size="12" weight="400" italic="1" />
			</title>
			<labels labelinterval="1" angle="0" format=".0" side="left" hide="0" >
				<font color="FF000000" facename="Arial" size="12" weight="400" italic="1" />
			</labels>
			<ticks majorticks="4" minorticks="4" side="left" hidefirst="0" hidelast="0" hideminorticks="0" hide="0" />
		</y1axis>
    <data>
      <outdoor_temperature axisbind="y1axis" legend="Température ext." color1="FFFF0000" antialiasing="1" filled="0" hide="0" thick="1.2"/>
    </data>
	<legend orientation="0" margin="5" width="250" position-x="10" position-y="1" hide="0" shadow="0">
      <font color="FF000000" facename="Arial" size="12" weight="400" italic="1" />
      <border cornerradius="0" color="55555555" thick="0" />
    </legend>
    <border cornerradius="0" color="55555555" thick="0" />
    <background color1="00000000" stretch="1" />
    <graphbackground color1="FFCCCCFF" color2="FFFFFFFF" gradient="1" gradient-direction="90" />
	</lineplot>
	<!-- ================= Statistics ================= -->
  <textbox width="200" height="50" shadow="0" position-x="10" position-y="160" margin="0" >
    <text alignement="left|top">
      <line text="Température Min: $Min[outdoor_temperature] $Unit[Temperature]  $MinDate[outdoor_temperature, à %Hh%M]"/>
      <line text="Température Max: $Max[outdoor_temperature] $Unit[Temperature]  $MaxDate[outdoor_temperature, à %Hh%M]"/>
    </text>
  </textbox>
</stylesheet>
---------------------------------------------
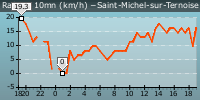
Pour le vent :

Ca donne cela :
Code : Tout sélectionner
<?xml version="1.0" encoding="iso-8859-1" ?>
<stylesheet>
	<image width="250" height="190" />
	<frame width="250" height="190" position-x="0" position-y="0" shadow="0">
		<title text="" alignement="horizontal" angle="0">
			<font color="FF000000" facename="Arial" size="14" weight="400" italic="0" />
		</title>
		<background color1="FFBBBBFF" color2="FFFFFFFF" gradient="1" gradient-direction="135" stretch="1" />
    <border cornerradius="0" color="55555555" thick="1" />
	</frame>
	<!-- ================= First Lineplot ================= -->
	<lineplot width="230" height="120" shadow="0" position-x="10" position-y="10" margin-top="10" margin-right="10" margin-bottom="10" margin-left="10">
		<xaxis color="FF000000" grid="1" autoscale="0" min="0" max="0">
			<labels labelinterval="1" angle="0"  side="left" hide="0">
				<font color="FF000000" facename="Arial" size="12" weight="400" italic="1" />
			</labels>
			<ticks majorticks="7" minorticks="4" side="bottom" hidefirst="0" hidelast="0" hideminorticks="0" hide="0" />
		</xaxis>
		<y1axis color="FF000000" grid="1" autoscale="1" min="0" max="0" titleside="left" titlemargin="35">
			<title text="Vitesse du vent ( $Unit[Speed] )" alignement="hcenter|vcenter" angle="0">
				<font color="FF000000" facename="Arial" size="12" weight="400" italic="1" />
			</title>
			<labels labelinterval="1" angle="0" format=".0" side="left" hide="0" >
				<font color="FF000000" facename="Arial" size="12" weight="400" italic="1" />
			</labels>
			<ticks majorticks="5" minorticks="4" side="left" hidefirst="0" hidelast="0" hideminorticks="0" hide="0" />
		</y1axis>
		<data>
      <wind_speed axisbind="y1axis" legend="Vitesse du vent" color1="66FF0000" color2="33FF0000" antialiasing="1" filled="1" />
      <wind_speed axisbind="y1axis" legend="Vitesse du vent" color1="66FF0000" antialiasing="1" filled="0" hidelegend="1" thick="1.2"/>
		</data>
      <legend orientation="0" margin="5" width="150" position-x="20" position-y="0" hide="0" shadow="0">
      <font color="FF000000" facename="Arial" size="12" weight="400" italic="1" />
    </legend>
    <border cornerradius="0" color="55555555" thick="0" />
    <background color1="00000000" stretch="1" />
    <graphbackground color1="FFCCCCFF" color2="FFFFFFFF" gradient="1" gradient-direction="90" />
	</lineplot>
	<!-- ================= Statistics ================= -->
  <textbox width="250" height="50" shadow="0" position-x="10" position-y="160" margin="0" >
    <text alignement="left|top">
      <line text="Vitesse maximale : $Max[wind_speed] $Unit[Speed] $MaxDate[wind_speed,à %Hh%M]"/>
      <line text="Vitesse moyenne : $Mean[wind_speed] $Unit[Speed]"/>
    </text>
  </textbox>
</stylesheet>
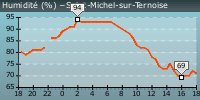
Et pour la Pression et l'humidité

Ca donne cela :
Code : Tout sélectionner
<?xml version="1.0" encoding="iso-8859-1" ?>
<stylesheet>
  <image width="280" height="190" />
  <frame width="280" height="190" position-x="0" position-y="0" shadow="0">
    <title text="" alignement="left|top" angle="0">
      <font color="FF000000" facename="Arial" size="14" weight="400" italic="0" />
    </title>
    <background color1="FFBBBBFF" color2="FFFFFFFF" gradient="1" gradient-direction="135" stretch="1" />
    <border cornerradius="0" color="55555555" thick="1" />
  </frame>
  <!-- ================= First Lineplot =================  -->
  <lineplot width="240" height="120" shadow="0" position-x="10" position-y="10" margin-top="10" margin-right="10" margin-bottom="10" margin-left="20">
	<xaxis color="FF000000" grid="1" autoscale="0" min="0" max="0">
		<title text="" alignement="vcenter|hcenter" angle="0">
			<font color="FF000000" facename="Arial" size="12" weight="400" italic="1" />
		</title>
		<labels labelinterval="1" angle="0"  side="left" hide="0">
			<font color="FF000000" facename="Arial" size="12" weight="400" italic="1" />
		</labels>
		<ticks majorticks="7" minorticks="3" side="bottom" hidefirst="0" hidelast="0" hideminorticks="0" hide="0" />
	</xaxis>
	<y1axis color="FF000000" grid="1" autoscale="1" min="0" max="0" titleside="top" titlemargin="35">
		<title text="Pression ($Unit[Pressure])" alignement="vcenter|hcenter" angle="0">
			<font color="FF000000" facename="Arial" size="12" weight="400" italic="1" />
		</title>
		<labels labelinterval="1" angle="0" format=".0" side="left" hide="0" >
			<font color="FF000000" facename="Arial" size="12" weight="400" italic="1" />
		</labels>
		<ticks majorticks="5" minorticks="4" side="left" hidefirst="0" hidelast="0" hideminorticks="0" hide="0" />
	</y1axis>
	<y2axis side="right" color="FF000000" grid="0" autoscale="0" min="0" max="100" titleside="right" titlemargin="30">
		<title text="Humidité (%)" alignement="vcenter|hcenter" angle="0">
			<font color="FF000000" facename="Arial" size="12" weight="400" italic="1" />
		</title>
		<labels labelinterval="1" angle="0" format=".1" side="right" hide="0">
			<font color="FF000000" facename="Arial" size="12" weight="400" italic="1" />
		</labels>
		<ticks majorticks="5" minorticks="4" side="right" hidefirst="0" hidelast="0" hideminorticks="0" hide="0" />
	</y2axis>
    <data>
      <outdoor_humidity axisbind="y2axis" legend="Humidité extérieure" color1="3000FF00" color2="300000FF" antialiasing="1" filled="1" hide="0" />
      <outdoor_humidity axisbind="y2axis" legend="Humidité extérieure" color1="300000FF" antialiasing="1" hidelegend="1" thick="1.2"/>

	<relative_pressure axisbind="y1axis" legend="Pression relative" color1="FF009000" antialiasing="1" filled="0" hide="0" thick="1.2" />
 </data>
    <legend orientation="0" margin="5" width="250" position-x="22" position-y="0" hide="0" shadow="0">
      <font color="FF000000" facename="Arial" size="12" weight="400" italic="1" />
      <border cornerradius="0" color="55555555" thick="0" />
    </legend>
    <border cornerradius="0" color="55555555" thick="0" />
    <background color1="00000000" stretch="1" />
    <graphbackground color1="FFCCCCFF" color2="FFFFFFFF" gradient="1" gradient-direction="90" />
  </lineplot>
  <!-- ================= Statistics ================= -->
  <textbox width="200" height="50" shadow="0" position-x="10" position-y="160" margin="0" >
    <text alignement="left|top">
      <line text="Pression rel Min: $Min[relative_pressure] $Unit[Pressure] $MinDate[relative_pressure,à %Hh%M]"/>
      <line text="Pression rel Max: $Max[relative_pressure] $Unit[Pressure] $MaxDate[relative_pressure, à %Hh%M]"/>
	  <line text="Humiditée ext Min: $Min[outdoor_humidity] % $MinDate[outdoor_humidity, à %Hh%M]"/>
	  <line text="Humiditée ext Max: $Max[outdoor_humidity] % $MaxDate[outdoor_humidity, à %Hh%M]"/>
    </text>
  </textbox>
</stylesheet>
--------------------------------
Voilà , Vous pouvez les modifier comme vous voulez , mais j'avais pensé à faire un genre de Réseau StatGW que Marco a déjà et donc d'intégrer aussi un logo StatGW dans ce genre de StyleSheet , je pense que c'est faisable mais je n'ai pas encore cherché à comment faire cela