mon fichier est un fichier "tab" que j'ai créé
ci joint ce fichier
Nouvelle station
-
ardigier

- Membre
- Messages : 2260
- Inscription : mar. mars 23, 2010 6:05 pm
- Localisation : Le Thor 84250
- Contact :
Re: Nouvelle station
Vous ne pouvez pas consulter les pièces jointes insérées à ce message.
WMR200 - XNet meteo 2011-10-14a- graphweather V 3.0.35- Win10 x64
webcam installée orientation NE
http://le-thor-meteo.com/index.php
webcam installée orientation NE
http://le-thor-meteo.com/index.php
-
Embrun
- Membre
- Messages : 32
- Inscription : mer. janv. 08, 2020 7:47 pm
- Localisation : La Tranche-sur-Mer
Re: Nouvelle station [Résolu]
Bonjour
Petite question au passage, quelle est la différence entre un fichier "tab" ou pas
Petite question au passage, quelle est la différence entre un fichier "tab" ou pas
-
ardigier
- Membre
- Messages : 2260
- Inscription : mar. mars 23, 2010 6:05 pm
- Localisation : Le Thor 84250
- Contact :
Re: Nouvelle station [Résolu]
Gw a plusieurs fichiers types
En fonction de ce qu’on veut afficher on choisi un modèle mais on peut aussi créer ses propres fichiers si on le souhaite des l’instant où on maitrise bien le xml et le php
En fonction de ce qu’on veut afficher on choisi un modèle mais on peut aussi créer ses propres fichiers si on le souhaite des l’instant où on maitrise bien le xml et le php
WMR200 - XNet meteo 2011-10-14a- graphweather V 3.0.35- Win10 x64
webcam installée orientation NE
http://le-thor-meteo.com/index.php
webcam installée orientation NE
http://le-thor-meteo.com/index.php
-
Embrun
- Membre
- Messages : 32
- Inscription : mer. janv. 08, 2020 7:47 pm
- Localisation : La Tranche-sur-Mer
Re: Nouvelle station
Bonsoir
Je suis loin de devenir un expert en xml.
Je fais des essais avec des modèles (dont ton fichier), et je souhaiterais supprimer l'axe 2 et 3 (le dernier est en dehors de l'image) à droite et j'essaye depuis 1 h, et je n'y arrive pas, tout s'en va, alors que si je supprime celui de gauche, à part l'axe, les courbes ne disparaissent pas ??
Et ça je n'y arrive même pas...........
Que faut-il faire ?
-
jturlier

- Membre
- Messages : 3150
- Inscription : mar. août 22, 2006 8:38 am
- Localisation : 34410 Sérignan - Languedoc
- Contact :
Re: Nouvelle station
Bonsoir,
pense que chaque élément est contenu dans un rectangle et que tu dois le positionner par rapport à son parent (ex lineplot est positionné par rapport à image)
Tu peux positionner des cadres (frame) par rapport à image et ensuite recouvrir ce frame avec par exemple un lineplot en donnant de la transparence au fond de ce lineplot.
Pour les axes Y ils se positionnent à droite ou à gauche des graphiques et ensuite leur position est définie par la balise margin.
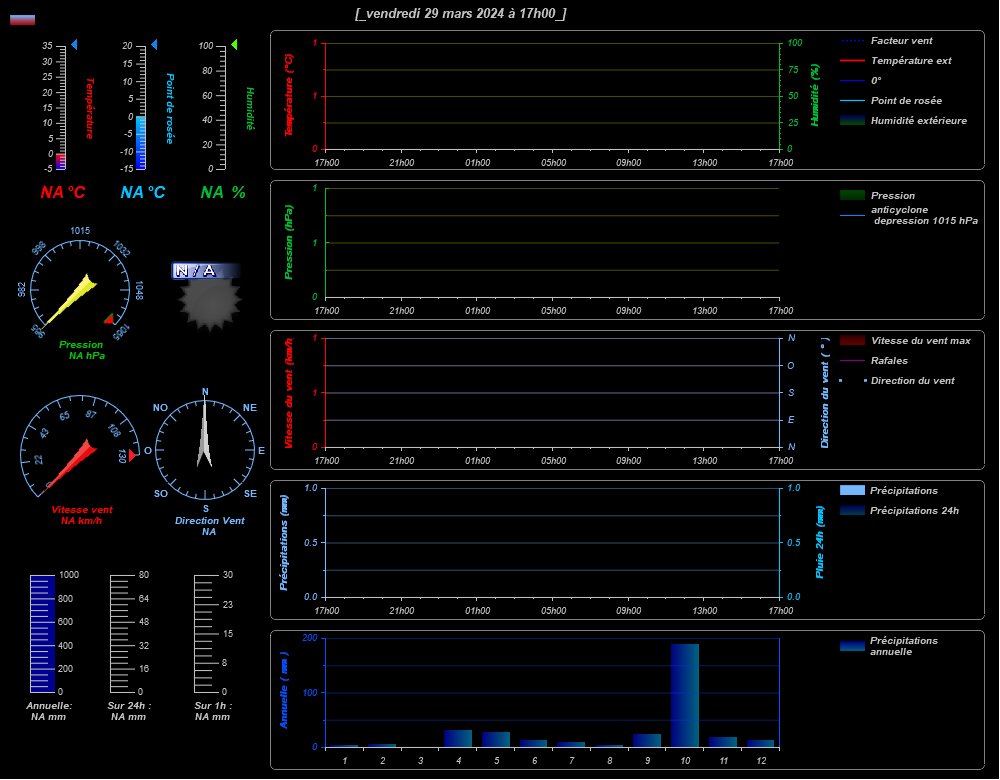
Par exemple, le code suivant est assez complet et tu pourras le récupérer et le tester.
Le résultat : http://meteoserignan.ddns.net/images_gw/zara.jpg
Cette image n'est plus mise à jour car GW est désactivé chez moi.
Je te suggère de visualiser d'abord l'image et de t'intéresser ensuite à ce qui peut t'intéresser dans le code... car c'est long !
pense que chaque élément est contenu dans un rectangle et que tu dois le positionner par rapport à son parent (ex lineplot est positionné par rapport à image)
Tu peux positionner des cadres (frame) par rapport à image et ensuite recouvrir ce frame avec par exemple un lineplot en donnant de la transparence au fond de ce lineplot.
Pour les axes Y ils se positionnent à droite ou à gauche des graphiques et ensuite leur position est définie par la balise margin.
Par exemple, le code suivant est assez complet et tu pourras le récupérer et le tester.
Le résultat : http://meteoserignan.ddns.net/images_gw/zara.jpg
Cette image n'est plus mise à jour car GW est désactivé chez moi.
Je te suggère de visualiser d'abord l'image et de t'intéresser ensuite à ce qui peut t'intéresser dans le code... car c'est long !
Code : Tout sélectionner
<?xml version="1.0" encoding="ISO-8859-1" ?>
<stylesheet>
	<image width="1000" height="780" />
<!--   ================= Background =================

  -->
  -
- <frame width="1000" height="780" position-x="0" position-y="0">
	<background color="FF000000"  />
	<!--<border cornerradius="0" color="FF000000" thick="1" /> inutile fond noir border noir-->
  </frame>

<!-- ================= Statistics ================= -->

	<textbox width="300" height="40" shadow="0" position-x="350" position-y="0" margin="5" >
		<text alignement="left|top">
			<line text="[_$CurrentDate[%A %d %B %Y à %Hh%M]_]"/>
			<font color="FFC0C0C0" facename="Arial" size="16" weight="800" italic="1" />
		</text>
	</textbox>

<!-- ================= frames autour des graphiques ================= -->

   <frame width="715" height="140" position-x="270" position-y="30">
  <background color="00000000" />
  <border cornerradius="5" color="FFffffff" thick=".5" />
  </frame>
   <frame width="715" height="140" position-x="270" position-y="180">
  <background color="00000000" />
  <border cornerradius="5" color="FFffffff" thick=".5" />
  </frame>
   <frame width="715" height="140" position-x="270" position-y="330">
  <background color="00000000" />
  <border cornerradius="5" color="FFffffff" thick=".5" />
  </frame>
   <frame width="715" height="140" position-x="270" position-y="480">
  <background color="00000000" />
  <border cornerradius="5" color="FFffffff" thick=".5" />
  </frame>
   <frame width="715" height="140" position-x="270" position-y="630">
  <background color="00000000" />
  <border cornerradius="5" color="FFffffff" thick=".5" />
  </frame>

	 <!--  ================= Temperature ,point de rosee humidite ================= -->
	 <!--  ================= Temperature ,point de rosee humidite ================= -->

- <lineplot width="800" height="150" shadow="0" position-x="260" position-y="10" margin-top="33" margin-right="280" margin-bottom="10" margin-left="65">

 - 	<xaxis color="FFC0C0C0" grid="0" autoscale="0" titleside="bottom">
- 		<labels labelinterval="1" angle="0" format="%Hh%M" side="left" hide="0">
			<font color="FFC0C0C0" facename="Arial" size="12" weight="400" italic="1" />
		</labels>
		<ticks majorticks="7" minorticks="3" side="bottom" />
	</xaxis>

- 	<y1axis color="FFFF0000" gridcolor="88888800" grid="1" autoscale="1" min="0" max="0" titleside="left" titlemargin="30">
-		<title text="Température ($Unit[Temperature])" alignement="vcenter|hcenter" angle="0">
			<font color="FFFF0000" facename="Arial" size="12" weight="600" italic="1" />
		</title>
- 		<labels format=".0" side="left">
			<font color="FFFF0000" facename="Arial" size="12" weight="400" italic="1" />
		</labels>
		<ticks majorticks="5" minorticks="4" side="left" />
	</y1axis>

	<y2axis ydelta="70" side="right" color="FF00BB33" grid="0" autoscale="0" min="0" max="100" titleside="right" titlemargin="30">
		<title text="Humidité (%)" alignement="vcenter|hcenter" angle="0">
			<font color="FF00BB33" facename="Arial" size="12" weight="600" italic="1" />
		</title>
		<labels labelinterval="1" angle="0" format=".0" side="right" hide="0">
			<font color="FF00BB33" facename="Arial" size="12" weight="400" italic="1" />
		</labels>
		<ticks autoticks="0" majorticks="5" minorticks="4" side="right" hidefirst="0" hidelast="0" hideminorticks="0" hide="0" />
	</y2axis>

- 	<legend position-x="830" position-y="20" hide="0" shadow="0">
		<font color="FFC0C0C0" facename="Arial" size="12" weight="800" italic="1" />
		<background color="00FFFFFF" />
	</legend>

-	<data>
		<wind_chill axisbind="y1axis" legend="Facteur vent" color1="FF0000FF" color2="FFC0C0C0" antialiasing="1" filled="0" hide="0" thick="1.2" pattern="CCCCCCCC" />
		<outdoor_temperature axisbind="y1axis" legend="Température ext" color1="FFFF0000" color2="FFC0C0C0" antialiasing="1" filled="0" hide="0" thick="2" />
		<threshold axisbind="y1axis" legend="0°" color1="FF0000FF" value="0" thick="1.0"/>
		<dew_point axisbind="y1axis" legend="Point de rosée" color1="FF00C4FF" color2="FF0000FF" antialiasing="1" filled="0" hide="0" thick="1.2"/>
		<outdoor_humidity axisbind="y2axis" legend="Humidité extérieure" color1="5000FF00" color2="500000FF" antialiasing="1" filled="1" hide="0" />
		<outdoor_humidity axisbind="y2axis" color1="300000FF" antialiasing="1" hidelegend="1" thick="1.2"/>
	</data>
  </lineplot>

<!-- ================= gaugeOutdoor Temperature ================= -->

	<lineargauge width="130" height="200" shadow="0" orientation="1" position-x="0" position-y="20" margin-top="26" margin-right="9" margin-bottom="50" margin-left="11" >
		<title text="$Current[outdoor_temperature] $Unit[Temperature]" alignement="relative" angle="0" position-x="0.47" position-y="0.86">
			<font color="FFFF0000" facename="Arial" size="18" weight="800" italic="1" />
		</title>
		<axis color="FFC0C0C0"  min="-5" max="35" side="hcenter" titlemargin="20">                      REGLAGE PLAGE TEMPERATURE
			<title text="Température" alignement="vcenter|hcenter" angle="180">
				<font color="FFFF0000" facename="Arial" size="12" weight="800" italic="1" />
			</title>
			<labels labelinterval="1" side="left" hide="0">
				<font color="FFC0C0C0" facename="Arial" size="12" weight="400" italic="1" />
			</labels>
			<ticks majorticks="9" minorticks="4" side="left" hidefirst="0" hidelast="0" hideminorticks="0" hide="0" minorticksize="5" majorticksize="9"/>
		</axis>
		<index>
			<current_outdoor_temperature color1="FF0000FF" color2="FFFF0000" filled="1" side="left" thick="9" axisdelta="0"/>
			<stats_day_max_outdoor_temperature texture="temp_max.png"  side="left" thick="9" axisdelta="0"/>
			<stats_day_min_outdoor_temperature texture="temp_mini.png"  side="left" thick="9" axisdelta="0"/>
		</index>
	</lineargauge>

<!-- ================= gauge Outdoor rose ================= -->

	<lineargauge width="130" height="200" shadow="0" orientation="1" position-x="80" position-y="20" margin-top="26" margin-right="9" margin-bottom="50" margin-left="11" >
		<title text="$Current[dew_point] $Unit[Temperature]" alignement="relative" angle="0" position-x="0.47" position-y="0.86">
			<font color="FF00C4FF" facename="Arial" size="18" weight="800" italic="1" />
		</title>
		<axis color="FFC0C0C0" min="-15" max="20" side="hcenter" titlemargin="20">                        REGLAGE PLAGE TEMPERATURE
			<title text="Point de rosée" alignement="vcenter|hcenter" angle="180">
				<font color="FF00C4FF" facename="Arial" size="12" weight="800" italic="1" />
			</title>
			<labels labelinterval="1" side="left" hide="0">
				<font color="FFC0C0C0" facename="Arial" size="12" weight="400" italic="1" />
			</labels>
			<ticks majorticks="8" minorticks="4" side="left" hidefirst="0" hidelast="0" hideminorticks="0" hide="0" minorticksize="5" majorticksize="9"/>
		</axis>
		<index>
			<current_dew_point color1="FF0000FF" color2="FF00C4FF" filled="1" side="left" thick="9" axisdelta="0"/>
			<stats_day_max_dew_point texture="temp_max.png"  side="left" thick="9" axisdelta="0"/>
			<stats_day_min_dew_point texture="temp_mini.png"  side="left" thick="9" axisdelta="0"/>
		</index>
	</lineargauge>

<!-- ================= gaugeOutdoor humidite ================= -->

	<lineargauge width="130" height="200" shadow="0" orientation="1" position-x="160" position-y="20" margin-top="26" margin-right="9" margin-bottom="50" margin-left="11" >
		<title text="$Current[outdoor_humidity] $Unit[outdoor_humidity] %" alignement="relative" angle="0" position-x="0.47" position-y="0.86">
			<font color="FF00BB33" facename="Arial" size="18" weight="800" italic="1" />
		</title>
		<axis color="FFC0C0C0" min="0" max="100" side="hcenter" titlemargin="20">
			<title text="Humidité" alignement="vcenter|hcenter" angle="180">
				<font color="FF00BB33" facename="Arial" size="12" weight="800" italic="1" />
			</title>
			<labels labelinterval="1" side="left" hide="0">
				<font color="FFC0C0C0" facename="Arial" size="12" weight="400" italic="1" />
			</labels>
			<ticks majorticks="6" minorticks="4" side="left" hidefirst="0" hidelast="0" hideminorticks="0" hide="0" minorticksize="5" majorticksize="9"/>
		</axis>
		<index>
			<current_outdoor_humidity color1="ff00FF00" color2="ff0000FF" filled="1" side="left" thick="9" axisdelta="0"/>
			<stats_day_max_outdoor_humidity texture="humidite_max.png"   side="left" thick="9" axisdelta="0"/>
			<stats_day_min_outdoor_humidity texture="humidite_mini.png"  side="left" thick="9" axisdelta="0"/>
		</index>
	</lineargauge>

 <!--  ================= pression =================   -->
 <!--  ================= pression =================   -->

- 	<lineplot width="800" height="200" shadow="0" position-x="260" position-y="165" margin-top="23" margin-right="280" margin-bottom="67" margin-left="65">
		<xaxis color="FFC0C0C0" grid="0" autoscale="0" min="0" max="0" titleside="bottom">
- 			<labels labelinterval="1" angle="0" format="%Hh%M" side="left" hide="0">
				<font color="FFC0C0C0" facename="Arial" size="12" weight="400" italic="1" />
			</labels>
			<ticks majorticks="7" minorticks="3" side="bottom" hidefirst="0" hidelast="0" hideminorticks="0" hide="0" />
		</xaxis>
- 		<y1axis side="left" color="FF00BB33" gridcolor="88888800"  grid="1" autoscale="1" titleside="left" titlemargin="30">
- 			<title text="Pression ($Unit[Pressure])" alignement="vcenter|hcenter" angle="0">
				<font color="FF00BB33" facename="Arial" size="12" weight="600" italic="1" />
			</title>
- 			<labels labelinterval="1" angle="0" format=".0" side="left" hide="0">
				<font color="FF00BB33" facename="Arial" size="12" weight="400" italic="1" />
			</labels>
			<ticks majorticks="5" minorticks="0" side="right" hidefirst="0" hidelast="0" hideminorticks="0" hide="0" />
		</y1axis>
- 		<legend position-x="830" position-y="175" hide="0" shadow="0">
			<font color="FFC0C0C0" facename="Arial" size="12" weight="800" italic="1" />
		</legend>
  		<data>
			<relative_pressure axisbind="y1axis" legend="Pression " color1="45009000" color2="4500FF00" antialiasing="1" filled="1" hide="0" thick="1.2" />
			<threshold axisbind="y1axis" legend="anticyclone \n depression 1015 hPa" color1="FF008CFF" value="1015" thick="1.0"/>
		</data>
	</lineplot>

<!-- ================= gaugeRelative Pressure ================= -->

	<circulargauge width="200" height="200" shadow="0" orientation="1" position-x="-20" position-y="190" margin-top="50" margin-right="50" margin-bottom="50" margin-left="50" >
		<title text="Pression \n$Current[relative_pressure,6.1] $Unit[Pressure]" alignement="relative" angle="0" position-x="0.5" position-y="0.8">
			<font color="FF00C600" facename="Arial" size="12" weight="800" italic="1" />
		</title>
		<axis color="FF72B8FF" min="965" max="1065" titlemargin="50" titleside="top" fromangle="-45" toangle="225">
			<labels labelinterval="1" side="0" hide="0">
				<font color="FF72B8FF" facename="Arial" size="12" weight="400" italic="0" />
			</labels>
			<ticks majorticks="7" minorticks="3" side="left" hidefirst="0" hidelast="0" hideminorticks="0" hide="0" minorticksize="5" majorticksize="9"/>
		</axis>
		<index>
			<current_relative_pressure color1="FFFF0000" color2="FF00FF00" filled="1"  texture="PRESSION.png" side="left" thick="9" axisdelta="0"/>
			<stats_day_min_relative_pressure color1="FFFF0000" color2="FF00FF00" texture="pression_min.png"  side="left" thick="9" axisdelta="0"/>
			<stats_day_max_relative_pressure color1="FFFF0000" color2="FF00FF00" texture="pression_max.png"  side="left" thick="9" axisdelta="0"/>
		</index>
	</circulargauge>

<!-- ================= Icon ================= -->

	<frame width="80" height="80" position-x="170" position-y="260">
		<background color="ff0000ff" texture="$WeatherForecast[Icon]" stretch="1" />
	</frame>

<!--  =================vitesse vent=================   -->

-	<lineplot width="800" height="200" shadow="0" position-x="260" position-y="315" margin-top="23" margin-right="280" margin-bottom="67" margin-left="65">
-		<xaxis color="FFC0C0C0" grid="0" autoscale="0" min="0" max="0">
- 			<labels labelinterval="1" angle="0" format="%Hh%M" side="left" hide="0">
				<font color="FFC0C0C0" facename="Arial" size="12" weight="400" italic="1" />
			</labels>
			<ticks majorticks="7" minorticks="3" side="bottom" hidefirst="0" hidelast="0" hideminorticks="0" hide="0" />
		</xaxis>
- 		<y1axis color="FFFF0000"   gridcolor="88880000"  grid="1" autoscale="1" min="0" max="0" titleside="top" titlemargin="30">
- 			<title text="Vitesse du vent ($Unit[Speed])" alignement="vcenter|hcenter" angle="0">
				<font color="FFFF0000" facename="Arial" size="12" weight="600" italic="1" />
			</title>
- 			<labels labelinterval="1" angle="0" format=".0" side="left" hide="0">
				<font color="FFFF0000" facename="Arial" size="12" weight="400" italic="1" />
			</labels>
		<ticks majorticks="1" minorticks="0" side="left" hidefirst="0" hidelast="0" hideminorticks="0" hide="0" />
		</y1axis>
- 		<y2axis side="right"  grid="1"  gridcolor="8872B8FF" color="FF72B8FF" autoscale="0" min="0" max="360" titleside="right" titlemargin="40">
- 			<title text="Direction du vent ( ° )" alignement="vcenter|hcenter" angle="0">
				<font color="FF72B8FF" facename="Arial" size="12" weight="600" italic="1" />
			</title>
- 			<labels labelinterval="1" angle="0" format=".0" side="right" hide="0" labels="N;E;S;O;N">
				<font color="FF72B8FF" facename="Arial" size="12" weight="400" italic="1" />
			</labels>
			<ticks majorticks="5" minorticks="0" side="right" hidefirst="0" hidelast="0" hideminorticks="0" hide="0" />
		</y2axis>
- 		<legend position-x="830" position-y="320" hide="0" shadow="0">
			<font color="FFC0C0C0" facename="Arial" size="12" weight="800" italic="1" />
		</legend>

- 		<data>
			<wind_speed axisbind="y1axis" legend="Vitesse du vent max" color1="66FF0000" color2="33FF0000" antialiasing="1" filled="1" />
			<wind_speed axisbind="y1axis" legend="Vitesse du vent" color1="66FF0000" antialiasing="1" filled="0" hidelegend="1" thick="1.2" />
			<wind_gust axisbind="y1axis" legend="Rafales" color1="FF800080" antialiasing="1" filled="0" hidelegend="0" thick="1.2" />
			<wind_direction axisbind="y2axis" legend="Direction du vent" color1="FF72B8FF" antialiasing="1" filled="0" hidelegend="0" thick="3" pattern="00000000" />
		</data>
	</lineplot>

	<!-- ================= gaugeWind speed ================= -->


	<circulargauge width="260" height="260" shadow="0" orientation="1" position-x="-50" position-y="325" margin-top="70" margin-right="70" margin-bottom="70" margin-left="70" >
		<title text="Vitesse vent \n$Current[wind_gust] $Unit[Speed]" alignement="relative" angle="0" position-x="0.5" position-y="0.73">
			<font color="FFFF0000" facename="Arial" size="12" weight="800" italic="1" />
		</title>
		<axis color="FF72B8FF" min="0" max="130" titlemargin="50" titleside="bottom" fromangle="0" toangle="225">
			<labels labelinterval="1" side="160" hide="0">
				<font color="FF72B8FF" facename="Arial" size="12" weight="400" italic="1" />
			</labels>
			<ticks majorticks="7" minorticks="2" side="bottom" hidefirst="0" hidelast="0" hideminorticks="0" hide="0" minorticksize="5" majorticksize="9"/>
		</axis>
		<index>
			<current_wind_gust color1="FFFF0000" color2="FF00FF00" filled="1"  texture="vitessevent.png" side="left" thick="9" axisdelta="0"/>
			<stats_day_max_wind_gust texture="vent_max.png"  side="left" thick="9" axisdelta="0"/>
 		</index>
	</circulargauge>

<!-- ================= Wind direction ================= -->
		<!-- ================= Radarplot ================= -->
	<radarplot width="190" height="190" shadow="0" orientation="1" position-x="110" position-y="355" margin-top="45" margin-right="45" margin-bottom="45" margin-left="45" >
		<axis color="0088BB88" grid="0" autoscale="1" min="0" max="0">
			<ticks autoticks="0" majorticks="0" minorticks="0" side="bottom" hidefirst="0" hidelast="0" hideminorticks="0" hide="1" />
		</axis>
		<data>
			<wind_direction legend="" color1="AAFF0000" color2="FF72B8FF" antialiasing="1" filled="1" />
			<wind_direction legend="" color1="AAFF0000" antialiasing="1" hidelegend="1" thick="1.2" />
		</data>
	</radarplot>

		<!-- =================gauge Wind direction ================= -->
	<circulargauge width="190" height="190" shadow="0" orientation="1" position-x="110" position-y="355" margin-top="45" margin-right="45" margin-bottom="45" margin-left="45" >
		<title text="Direction Vent \n$Current[wind_direction,f1]" alignement="relative" angle="0" position-x="0.52" position-y="0.9">
			<font color="FF72B8FF" facename="Arial" size="12" weight="800" italic="1" />
		</title>
		<axis color="FF72B8FF" min="0" max="360" titlemargin="20" titleside="bottom" fromangle="90" toangle="450">
			<labels labels="N;NO;O;SO;S;SE;E;NE" labelinterval="1" side="top" hide="0">
				<font color="FF72B8FF" facename="Arial" size="12" weight="800" italic="0" />
			</labels>
			<ticks majorticks="9" minorticks="3" side="bottom" hidefirst="0" hidelast="0" hideminorticks="0" hide="0" minorticksize="5" majorticksize="9"/>
		</axis>
		<index>
			<current_wind_direction color1="FFFF0000" color2="FF00FF00" filled="1"  texture="directionvent.png" side="left" thick="9" axisdelta="0"/>
		</index>
	</circulargauge>

<!--  ================= precipitation =================  -->
<!--  ================= precipitation =================  -->

	<lineplot width="800" height="200" shadow="0" position-x="260" position-y="465" margin-top="23" margin-right="280" margin-bottom="67" margin-left="65">
- 		<xaxis color="FFC0C0C0" grid="0" autoscale="0" min="0" max="0">
- 			<labels labelinterval="1" angle="0" format="%Hh%M" side="left" hide="0">
				<font color="FFC0C0C0" facename="Arial" size="12" weight="400" italic="1" />
			</labels>
			<ticks majorticks="7" minorticks="3" side="bottom" hidefirst="0" hidelast="0" hideminorticks="0" hide="0" />
		</xaxis>
- 		<y1axis side="left" gridcolor="6672B8FF" color="FF72B8FF" grid="1" autoscale="1" min="0" max="300" titleside="left" titlemargin="35">
- 			<title text="Précipitations ($Unit[Rainfall])" alignement="vcenter|hcenter" angle="0">
				<font color="FF72B8FF" facename="Arial" size="12" weight="600" italic="1" />
			</title>
- 			<labels labelinterval="1" angle="0" format=".1" side="left" hide="0">
				<font color="FF72B8FF" facename="Arial" size="12" weight="400" italic="1" />
			</labels>
			<ticks majorticks="5" minorticks="4" side="left" hidefirst="0" hidelast="0" hideminorticks="0" hide="0" />
		</y1axis>
- 		<y2axis side="right"  gridcolor="8872B8FF" color="FF00C4FF" grid="0" autoscale="1" min="0" max="300" titleside="right" titlemargin="35" ydelta="55">
- 			<title text="Pluie 24h ($Unit[Rainfall])" alignement="vcenter|hcenter" angle="0">
				<font color="FF00C4FF" facename="Arial" size="12" weight="600" italic="1" />
			</title>
- 			<labels labelinterval="1" angle="0" format=".1" side="right" hide="0">
				<font color="FF00C4FF" facename="Arial" size="12" weight="400" italic="1" />
			</labels>
			<ticks majorticks="5" minorticks="4" side="right" hidefirst="0" hidelast="0" hideminorticks="0" hide="0" />
		</y2axis>
- 		<legend position-x="830" position-y="470" hide="0" shadow="0">
			<font color="FFC0C0C0" facename="Arial" size="12" weight="800" italic="1" />
		</legend>
		<data>
			<relative_rainfall axisbind="y1axis" legend="Précipitations" color1="FF72B8FF" color2="FF72B8FF" antialiasing="1" filled="1" />
			<relative_rainfall axisbind="y1axis" legend="Précipitations" color1="FF72B8FF" antialiasing="1" filled="0" hidelegend="1" thick="1.2" />
			<rainfall_24h axisbind="y2axis" legend="Précipitations 24h"  color1="5000C4FF" color2="500000FF" antialiasing="1" filled="1" hidelegend="0" thick="1.2" />
		</data>
	</lineplot>

<!-- ================= pluie annee ================= -->
<!-- ================= pluie annee ================= -->

	<bargraph width="800" height="200" shadow="0" position-x="260" position-y="615" margin-top="23" margin-right="280" margin-bottom="67" margin-left="65">
		<xaxis color="FFC0C0C0" >
			<labels labelinterval="1" labels="Janv.;Fév.;Mars;Avril;Mai;Juin;Juil.;Août;Sep.;Oct.;Nov.;Déc." angle="0"  side="left" hide="0">
				<font color="FFC0C0C0" facename="Arial" size="12" weight="400" italic="1" />
			</labels>
			<ticks majorticks="7" minorticks="4" side="bottom" hidefirst="0" hidelast="0" hideminorticks="0" hide="0" />
		</xaxis>
		<y1axis color="ff004FFF"  gridcolor="66004FFF" grid="1" autoscale="1" min="0" max="0" titleside="top" titlemargin="35">
			<title text=" Annuelle ( $Unit[Rainfall] )" alignement="vcenter|hcenter" angle="0">
				<font color="ff004FFF" facename="Arial" size="12" weight="600" italic="1" />
			</title>
			<labels labelinterval="1" angle="0" format=".0" side="left" hide="0" >
				<font color="ff004FFF" facename="Arial" size="12" weight="400" italic="1" />
			</labels>
			<ticks majorticks="5" minorticks="4" side="left" hidefirst="0" hidelast="0" hideminorticks="0" hide="0" />
		</y1axis>
		<y2axis color="ff004FFF" grid="1" side="right" autoscale="1" min="0" max="0" titleside="top" titlemargin="35">
			<labels  hide="1" >
			</labels>
			<ticks hide="1" />
		</y2axis>
		<data>
			<stats_2019_totalrainfall axisbind="y1axis" legend="Précipitations\nannuelle" color1="8000C4FF" color2="800000FF" antialiasing="1" filled="1" />
		</data>
		<legend orientation="0" width="665" position-x="830" position-y="626" hide="0" shadow="0">
			<font color="FFC0C0C0" facename="Arial" size="12" weight="800" italic="1" />
		</legend>
	</bargraph>

	<!-- ================= gauge Absolute rainfall ================= -->

	<lineargauge width="20" height="200" shadow="0" orientation="1" position-x="30" position-y="535" margin-top="40" margin-right="0" margin-bottom="42" margin-left="0" >
		<title text="Annuelle:\n$Stats[Year,TotalRainfall] $Unit[Rainfall]" alignement="relative" angle="0" position-x="0.90" position-y="0.88">
			<font color="FFC0C0C0" facename="Arial" size="12" weight="800" italic="1" />
		</title>
		<axis color="FFC0C0C0" min="0" max="1000" side="left" titlemargin="30" titleside="left">
			<labels labelinterval="1" side="right" hide="0">
				<font color="FFC0C0C0" facename="Arial" size="12" weight="400" italic="0" />
			</labels>
			<ticks majorticks="6" minorticks="3" side="right" hidefirst="0" hidelast="0" hideminorticks="0" hide="0" minorticksize="18" majorticksize="25"/>
		</axis>
		<index>
			<stats_year_totalrainfall color1="FF00008F" color2="FF00008F" filled="1" reverse="0" side="right" thick="25" axisdelta="0"/>
		</index>
	</lineargauge>

	<!-- ================= gauge rainfall 24h ================= -->

	<lineargauge width="20" height="200" shadow="0" orientation="1" position-x="110" position-y="535" margin-top="40" margin-right="0" margin-bottom="42" margin-left="0" >
		<title text="Sur 24h :\n$Current[rainfall_24h] $Unit[Rainfall]" alignement="relative" angle="0" position-x="0.90" position-y="0.88">
			<font color="FFC0C0C0" facename="Arial" size="12" weight="800" italic="1" />
		</title>
		<axis color="FFC0C0C0" min="0" max="80" side="left" titlemargin="30" titleside="left">
			<labels labelinterval="1" side="right" hide="0">
				<font color="FFC0C0C0" facename="Arial" size="12" weight="400" italic="0" />
			</labels>
			<ticks majorticks="6" minorticks="3" side="right" hidefirst="0" hidelast="0" hideminorticks="0" hide="0" minorticksize="18" majorticksize="25"/>
		</axis>
		<index>
			<current_rainfall_24h color1="FF00008F" color2="FF00008F"  filled="1" reverse="0" side="right" thick="25" axisdelta="0"/>
		</index>
	</lineargauge>

	<!-- =================gauge rainfall 1h ================= -->

	<lineargauge width="20" height="200" shadow="0" orientation="1" position-x="194" position-y="535" margin-top="40" margin-right="0" margin-bottom="42" margin-left="0" >
		<title text="Sur 1h :\n$Current[rainfall_1h] $Unit[Rainfall]" alignement="relative" angle="0" position-x="0.9" position-y="0.88">
			<font color="FFC0C0C0" facename="Arial" size="12" weight="800" italic="1" />
		</title>
		<axis color="FFC0C0C0" min="0" max="30" side="left" titlemargin="30" titleside="left">
			<labels labelinterval="1" side="right" hide="0">
				<font color="FFC0C0C0" facename="Arial" size="12" weight="400" italic="0" />
			</labels>
			<ticks majorticks="5" minorticks="3" side="right" hidefirst="0" hidelast="0" hideminorticks="0" hide="0" minorticksize="18" majorticksize="25"/>
		</axis>
		<index>
			<current_rainfall_1h color1="FF00008F" color2="FF00008F" filled="1" reverse="0" side="right" thick="25" axisdelta="0"/>
		</index>
	</lineargauge>
</stylesheet>
Jean
Station : VP2 Pro Console Vue + anémomètre à Ultra-sons
Logiciels : Cumulus 1.9.4 + Cumulus2SQL
Serveur local : Apache + MySQL +PHP
PC : W10
Support Audio : FR
http://meteoserignan.ddns.net

"Aide-toi d'abord toi-même et les autres t'aideront ... peut-être"
Station : VP2 Pro Console Vue + anémomètre à Ultra-sons
Logiciels : Cumulus 1.9.4 + Cumulus2SQL
Serveur local : Apache + MySQL +PHP
PC : W10
Support Audio : FR
http://meteoserignan.ddns.net
"Aide-toi d'abord toi-même et les autres t'aideront ... peut-être"
-
Embrun
- Membre
- Messages : 32
- Inscription : mer. janv. 08, 2020 7:47 pm
- Localisation : La Tranche-sur-Mer
Re: Nouvelle station
D'accord, je regarde ça
Merci encore de ton aide
Merci encore de ton aide
-
paaubert

- Membre
- Messages : 2624
- Inscription : dim. janv. 17, 2010 7:16 pm
- Localisation : 1555 Villarzel - Switzerland
- Contact :
Re: Nouvelle station
_________________________________________________________________________________________________________
Station Vantage Pro2+ avec station agricole - Weatherlink 6.0.3 - GraphWeather 3.0.15b - Cumulus 1.9.4 - Windows W10 ultimate x64
http://www.boock.ch/meteo-villarzel.php

Station Vantage Pro2+ avec station agricole - Weatherlink 6.0.3 - GraphWeather 3.0.15b - Cumulus 1.9.4 - Windows W10 ultimate x64
http://www.boock.ch/meteo-villarzel.php