bonjour à tous,
Voici mon soucis:
J'utilise un fichier .xml pour me tracer les graphs de précipitations journalières dont voici un exemple ci-dessous pour le mois de mars 2015:
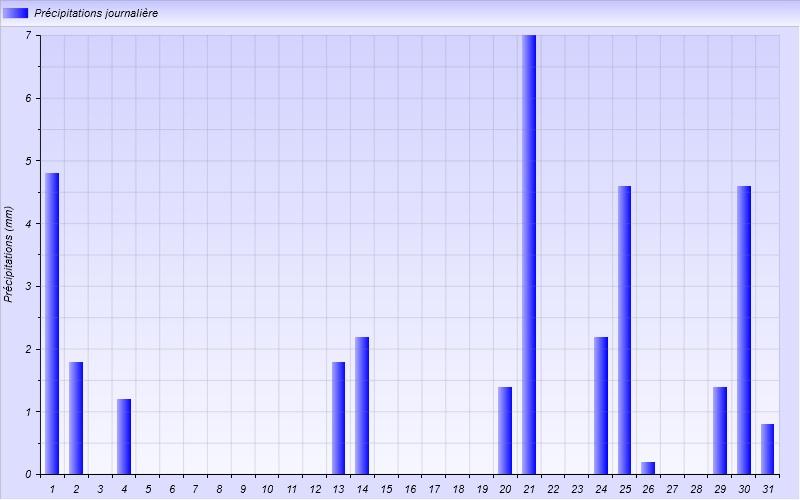
Le problème c'est que le graph ne se créer pas si je ne suis pas dans le mois en cours. Par exemple si je veux la période du mois précédent (01/02 au 01/03) le graph reste vide ! Suis-je clair ?
Quelqu'un à une idée du pourquoi ? merci bien
Voici le code du .xml:
<?xml version="1.0" encoding="iso-8859-1" ?>
<stylesheet>
<image width="800" height="500" />
<frame width="800" height="500" position-x="0" position-y="0" shadow="0">
<title text="" alignement="3" angle="0">
<font color="FF000000" facename="Arial" size="14" weight="400" italic="0" />
</title>
<background color1="FFDDDDFF" color2="FFFFFFFF" gradient="0" gradient-direction="135" stretch="1" />
<border cornerradius="0" color="55555555" thick="1" />
</frame>
<!-- ================= First Lineplot ================= -->
<bargraph width="800" height="470" shadow="0" position-x="0" position-y="35" margin-top="0" margin-right="20" margin-bottom="30" margin-left="40">
<xaxis color="FF000000" grid="1" autoscale="1" min="0" max="0">
<labels labelinterval="1" angle="0" side="left" hide="0" format="%Y">
<font color="FF000000" facename="Arial" size="14" weight="400" italic="1" />
</labels>
<ticks majorticks="7" minorticks="4" side="bottom" hidefirst="0" hidelast="0" hideminorticks="0" hide="0" />
</xaxis>
<y1axis color="FF000000" grid="1" autoscale="1" min="0" max="0" y-base="0.0" titleside="left" titlemargin="25">
<title text="Précipitations ($UNIT[RAINFALL])" alignement="vcenter|hcenter" angle="0">
<font color="FF000000" facename="Arial" size="14" weight="400" italic="1" />
</title>
<labels labelinterval="2" angle="0" format=".0" side="left" hide="0" >
<font color="FF000000" facename="Arial" size="14" weight="400" italic="1" />
</labels>
<ticks majorticks="1" minorticks="4" side="left" hidefirst="0" hidelast="0" hideminorticks="0" hide="0" />
</y1axis>
<data>
<stats_month_totalrainfall axisbind="y1axis" legend="Précipitations journalière" color1="FFAAAAFF" color2="FF0000FF" gradient="horizontal" antialiasing="1" filled="1" />
</data>
<legend orientation="0" margin="3" width="900" position-x="0" position-y="0" hide="0" shadow="0">
<font color="FF000000" facename="Arial" size="14" weight="400" italic="1" />
<border cornerradius="0" color="55555555" thick="1" />
<background color1="FFBBBBFF" color2="FFFFFFFF" gradient="1" gradient-direction="90"/>
</legend>
<graphbackground color1="FFCCCCFF" color2="FFFFFFFF" gradient="1" gradient-direction="90" />
</bargraph>
</stylesheet>

