OK, je n'avais pas compris,
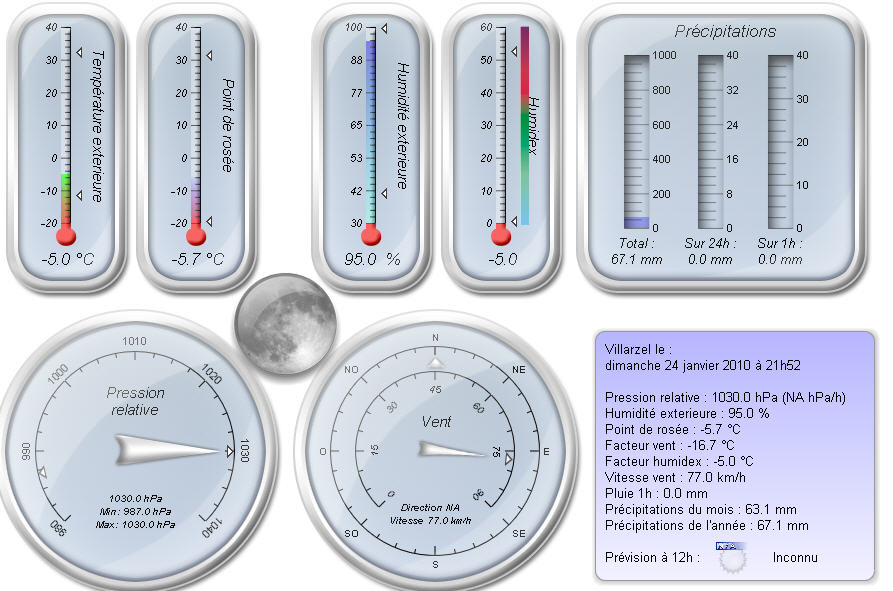
En essayant ta feuille de style, je ne comprends toujours pas où est ton pb, Le résultat qui s'affiche correspond bien à ce que tu as fait.
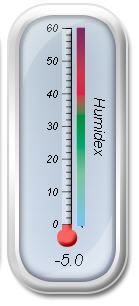
la bande multicolore correspond bien à la sonde current_heat_index .
Pièce jointe:
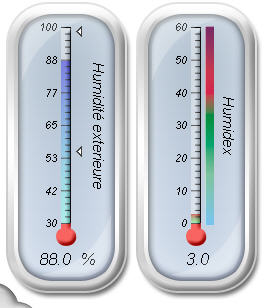
essai_humidex.jpg
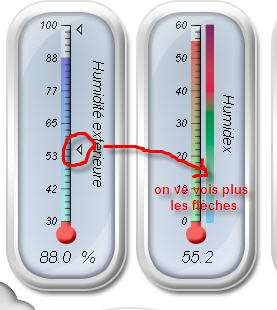
Si par contre tu veux mettre cette barre en background de tes flèches, il faut que tu crées un index avec une sonde qui a un maxi élevé comme par ex l'humidité,
Pièce jointe:
essai2_humidex.jpg
<index>
<stats_day_max_heat_index texture="img_modern_index_20x24.png" side="left" thick="9" axisdelta="0"/>
<stats_day_min_heat_index texture="img_modern_index_20x24.png" side="left" thick="9" axisdelta="0"/>
<max_outdoor_temperature color1="FFff0000" color2="FFff0000" filled="1" side="left" thick="9" axisdelta="0"/><current_outdoor_humidity color1="8000FF33" color2="FFCC0000" filled="1" side="right" thick="9" axisdelta="6"/></index>
<border cornerradius="0" color="FF000000" thick="0" />
<background color="ff0000ff" texture="img_modern_thermo1_130x300.png" stretch="1" />
<gaugebackground color="FF000000" texture="" />
</lineargauge>
<frame width="130" height="300" position-x="455" position-y="0">
<background color="ff0000ff" texture="img_modern_thermo2_130x300.png" stretch="1" />
</frame>Est-ce ce que tu voulais ?
Bonne soirée
Jean