Voila...tout le code au complet

juste a coplier le tout et le coller dans une nouvelle page xml ensuite,tu y vas avec essai et erreur...le plus long a faire hahaha.
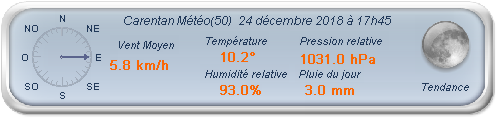
je vais regarder dans mes autres stylesheet,j'en ai tellement telecharger que j'ai surement ce qui faut

Code :
<?xml version="1.0" encoding="iso-8859-1" ?>
<stylesheet>
<!-- %%%%%%%%%%%%%%%%%%%%%%%%%%%%%%%%%%%%%%%%%%%%%%%%%%%%%%%%%%%%%%%%%%%%%%% -->
<!-- %% CVT_PRECIPITATIONS_4G %%%%%%%%%%%%%%%%%%%%%%%%%%%%%%%%%%%%%%%%%%%%%% -->
<!-- %% Olivier CHAUVET 2012 %%%%%%%%%%%%%%%%%%%%%%%%%%%%%%%%%%%%%%%%%%%%%%% -->
<!-- %%%%%%%%%%%%%%%%%%%%%%%%%%%%%%%%%%%%%%%%%%%%%%%%%%%%%%%%%%%%%%%%%%%%%%% -->
<!-- == DEFINITION FENETRE ================================================= -->
<!-- == WIDTH = LARGEUR GLOBALE FENETRE (Pixels) ========================= -->
<!-- == HEIGHT = HAUTEUR GLOBALE FENETRE (Pixels) ========================= -->
<image
width="900"
height="880" />
<!-- /////////////////////////////////////////////////////////////////////// -->
<!-- == DEFINITION TAILLE AFFICHAGE ======================================= -->
<!-- == WIDTH = LARGEUR FENETRE (Pixels) ============================== -->
<!-- == HEIGHT = HAUTEUR FENETRE (Pixels) ============================= -->
<!-- == Positionx = POS HAUTEUR FENETRE (Pixels) PAR RAP FENETRE GLOBALE == -->
<!-- == PositionY = POS HAUTEUR FENETRE (Pixels) PAR RAP FENETRE GLOBALE == -->
<frame
width="900"
height="880"
position-x="0"
position-y="0">
<background
color="FF000000"
texture=""
tretch= ""/>
<border
cornerradius= ""
color="FFFF0000"
thick="2"/>
</frame>
<!-- == GRAPHIQUE_PRECIPITATIONS ========================================= -->
<!-- == CARACTERISTIQUE CADRE GRAPHIQUE =================================== -->
<lineplot
width="875"
height="210"
shadow="000"
position-x="10"
position-y="5"
margin-top="20"
margin-right="20"
margin-bottom="30"
margin-left="65">
<border
cornerradius="0"
color="FF0000FF"
thick="0" />
<background
color1="FF000000"
stretch="1" />
<!-- == AXES ============================================================== -->
<!-- == GRID=0 Pas Affichage ============================================== -->
<!-- == GRID=1 Affichage ================================================== -->
<!-- == AXES X ============================================================ -->
<xaxis
color="FFFF0000"
grid="0"
autoscale="0"
min="0"
max="0">
<!-- == TITRE ECHELLE AXES X ============================================== -->
<title
text=""
alignement="vcenter|hcenter"
angle="0">
<font
color="FF000000"
facename="Arial"
size="12"
weight="400"
italic="1" />
</title>
<!-- == UNITES AXE X ====================================================== -->
<!-- == LABEL=1 on Affiche TOUT =========================================== -->
<!-- == LABEL=2 On affiche 1 sur 2 ======================================== -->
<labels
labelinterval="1"
angle="0"
side="left"
hide="0">
<font
color="FFFFFFFF"
facename="Arial"
size="12"
weight="800"
italic="1" />
</labels>
<!-- == GRADUATION AXE X ================================================== -->
<!-- == MAJORSTICK=7 Affichage Tranche de 4 Heures ======================== -->
<!-- == MAJORSTICK=9 Affichage Tranche de 3 Heures ======================== -->
<!-- == MINORSTICK=5 Affichage Tranche de 30 Minutes ====================== -->
<ticks
majorticks="7"
minorticks="3"
side="bottom"
hidefirst="0"
hidelast="0"
hideminorticks="0"
hide="0" />
</xaxis>
<!-- == AXES Y ============================================================ -->
<y1axis
color="FFFF0000"
grid="0"
autoscale="1"
min="0"
max="0"
titleside="top"
titlemargin="35">
<!-- == TITRE ECHELLE AXES Y ============================================== -->
<title
text="Précipitations ($Unit[Rainfall])"
alignement="20"
angle="0">
<font
color="FFFFFFFF"
facename="Arial"
size="14"
weight="800"
italic="1" />
</title>
<!-- == UNITES AXE Y ====================================================== -->
<!-- == LABEL=1 on Affiche TOUT =========================================== -->
<!-- == LABEL=2 On affiche 1 sur 2 ======================================== -->
<!-- == FORMAT.1 Affiche 1 Chiffre Après la virgule ======================= -->
<labels
labelinterval="1"
angle="0"
format=".1"
side="left"
hide="0" >
<font
color="FFFFFFFF"
facename="Arial"
size="12"
weight="800"
italic="1" />
</labels>
<!-- == GRADUATION AXE Y ================================================== -->
<ticks
majorticks="4"
minorticks="4"
side="left"
hidefirst="0"
hidelast="0"
hideminorticks="0"
hide="0" />
</y1axis>
<!-- == COURBES / DONNEES ================================================= -->
<data>
<relative_rainfall
axisbind="y1axis"
legend="PRECIPITATIONS ."
color1="33FFFF00"
color2="66FF0000"
antialiasing="1"
filled="1" />
<relative_rainfall
axisbind="y1axis"
legend=""
hidelegend="1"
color1="FFFF0000"
antialiasing="1"
filled="0"
thick="2"/>
</data>
<!-- == CADRE LEGENDE ===================================================== -->
<legend
orientation="0"
margin="000"
width="250"
position-x="350"
position-y="8"
hide="0"
shadow="0">
<font
color="FFFFFFFF"
facename="Arial"
size="14"
weight="800"
italic="1" />
<border
cornerradius="10"
color="00000000"
thick="1" />
<background
color1="00000000"
color2="00000000"
gradient="1"
gradient-direction="90"/>
</legend>
<!-- == COURBES / DONNEES ================================================= -->
<border
cornerradius="0"
color="5555555"
thick="0" />
<background
color1="00000000"
stretch="1" />
<!-- == FOND GRAPHIQUE ==================================================== -->
<graphbackground
color1="FF000000"
color2="FF000000"
gradient="1"
gradient-direction="90" />
</lineplot>
<!-- /////////////////////////////////////////////////////////////////////// -->
<!-- == PRECIPITATIONS 1 HEURE ============================================= -->
<!-- /////////////////////////////////////////////////////////////////////// -->
<!-- == CARACTERISTIQUE CADRE GRAPHIQUE =================================== -->
<lineplot
width="875"
height="220"
shadow="000"
position-x="10"
position-y="220"
margin-top="20"
margin-right="20"
margin-bottom="30"
margin-left="65">
<border
cornerradius="0"
color="FF0000FF"
thick="0" />
<background
color1="FF000000"
stretch="1" />
<!-- == AXES ============================================================== -->
<!-- == GRID=0 Pas Affichage ============================================== -->
<!-- == GRID=1 Affichage ================================================== -->
<!-- == AXES X ============================================================ -->
<xaxis
color="FFFF0000"
grid="0"
autoscale="0"
min="0"
max="0">
<!-- == TITRE ECHELLE AXES X ============================================== -->
<title
text=""
alignement="vcenter|hcenter"
angle="0">
<font
color="FF000000"
facename="Arial"
size="12"
weight="400"
italic="1" />
</title>
<!-- == UNITES AXE X ====================================================== -->
<!-- == LABEL=1 on Affiche TOUT =========================================== -->
<!-- == LABEL=2 On affiche 1 sur 2 ======================================== -->
<labels
labelinterval="1"
angle="0"
side="left"
hide="0">
<font
color="FFFFFFFF"
facename="Arial"
size="12"
weight="800"
italic="1" />
</labels>
<!-- == GRADUATION AXE X ================================= -->
<!-- == MAJORSTICK=7 Affichage Tranche de 4 Heures ======= -->
<!-- == MAJORSTICK=9 Affichage Tranche de 3 Heures ======= -->
<!-- === MINORSTICK=3 Affichage Tranche de 60 Minutes ===== -->
<ticks
majorticks="7"
minorticks="3"
side="bottom"
hidefirst="0"
hidelast="0"
hideminorticks="0"
hide="0" />
</xaxis>
<!-- == AXES Y ============================================================ -->
<y1axis
color="FFFF0000"
grid="0"
autoscale="1"
min="0"
max="0"
titleside="top"
titlemargin="35">
<!-- == TITRE ECHELLE AXES Y ============================================== -->
<title
text="Précipitations ($Unit[Rainfall])"
alignement="20"
angle="0">
<font
color="FFFFFFFF"
facename="Arial"
size="14"
weight="800"
italic="1" />
</title>
<!-- == UNITES AXE Y ====================================================== -->
<!-- == LABEL=1 on Affiche TOUT =========================================== -->
<!-- == LABEL=2 On affiche 1 sur 2 ======================================== -->
<!-- == FORMAT.1 Affiche 1 Chiffre Après la virgule ======================= -->
<labels
labelinterval="1"
angle="0"
format=".1"
side="left"
hide="0" >
<font
color="FFFFFFFF"
facename="Arial"
size="12"
weight="800"
italic="1" />
</labels>
<!-- == GRADUATION AXE Y ================================================== -->
<ticks
majorticks="4"
minorticks="4"
side="left"
hidefirst="0"
hidelast="0"
hideminorticks="0"
hide="0" />
</y1axis>
<!-- == COURBES / DONNEES ================================================= -->
<data>
<rainfall_1h
axisbind="y1axis"
legend="PRECIPITATIONS SUR 1 HEURE ."
color1="33FFFF00"
color2="66FF0000"
antialiasing="1"
filled="1" />
<rainfall_1h
axisbind="y1axis"
legend=""
hidelegend="1"
color1="FFFF0000"
antialiasing="1"
filled="0"
thick="2"/>
</data>
<!-- === LEGENDE / CADRE LEGENDE ========================================== -->
<legend
orientation="0"
margin="000"
width="250"
position-x="350"
position-y="221"
hide="0"
shadow="0">
<font
color="FFFFFFFF"
facename="Arial"
size="14"
weight="800"
italic="1" />
<border
cornerradius="10"
color="00000000"
thick="1" />
<background
color1="00000000"
color2="00000000"
gradient="1"
gradient-direction="90"/>
</legend>
<!-- == FOND GRAPHIQUE ==================================================== -->
<graphbackground
color1="FF000000"
color2="FF000000"
gradient="1"
gradient-direction="90" />
</lineplot>
<!-- /////////////////////////////////////////////////////////////////////// -->
<!-- == PRECIPITATION DERNIERE 24H00 ======================================= -->
<!-- /////////////////////////////////////////////////////////////////////// -->
<!-- == CARACTERISTIQUE CADRE GRAPHIQUE =================================== -->
<lineplot
width="875"
height="220"
shadow="000"
position-x="10"
position-y="445"
margin-top="20"
margin-right="20"
margin-bottom="30"
margin-left="65">
<border
cornerradius="0"
color="FF0000FF"
thick="0" />
<background
color1="FF000000"
stretch="1" />
<!-- == AXES ============================================================== -->
<!-- == GRID=0 Pas Affichage ============================================== -->
<!-- == GRID=1 Affichage ================================================== -->
<!-- == AXES X ============================================================ -->
<xaxis
color="FFFF0000"
grid="0"
autoscale="0"
min="0"
max="0">
<!-- == TITRE ECHELLE AXES X ============================================== -->
<title
text=""
alignement="vcenter|hcenter"
angle="0">
<font
color="FF000000"
facename="Arial"
size="12"
weight="400"
italic="1" />
</title>
<!-- == UNITES AXE X ====================================================== -->
<!-- == LABEL=1 on Affiche TOUT =========================================== -->
<!-- == LABEL=2 On affiche 1 sur 2 ======================================== -->
<labels
labelinterval="1"
angle="0"
side="left"
hide="0">
<font
color="FFFFFFFF"
facename="Arial"
size="12"
weight="800"
italic="1" />
</labels>
<!-- ================= GRADUATION AXE X ================================= -->
<!-- ================= MAJORSTICK=7 Affichage Tranche de 4 Heures ======= -->
<!-- ================= MAJORSTICK=9 Affichage Tranche de 3 Heures ======= -->
<!-- ================= MINORSTICK=5 Affichage Tranche de 30 Minutes ===== -->
<ticks
majorticks="7"
minorticks="3"
side="bottom"
hidefirst="0"
hidelast="0"
hideminorticks="0"
hide="0" />
</xaxis>
<!-- == AXES Y ============================================================ -->
<y1axis
color="FFFF0000"
grid="0"
autoscale="1"
min="0"
max="0"
titleside="top"
titlemargin="35">
<!-- == TITRE ECHELLE AXES Y ============================================== -->
<title
text="Précipitations ($Unit[Rainfall])"
alignement="20"
angle="0">
<font
color="FFFFFFFF"
facename="Arial"
size="14"
weight="800"
italic="1" />
</title>
<!-- ================= UNITES AXE Y ======================================= -->
<!-- ================= LABEL=1 on Affiche TOUT ============================ -->
<!-- ================= LABEL=2 On affiche 1 sur 2 ========================= -->
<!-- ================= FORMAT.1 Affiche 1 Chiffre Après la virgule ======== -->
<labels
labelinterval="1"
angle="0"
format=".1"
side="left"
hide="0" >
<font
color="FFFFFFFF"
facename="Arial"
size="12"
weight="800"
italic="1" />
</labels>
<!-- ================= GRADUATION AXE Y =================================== -->
<ticks
majorticks="4"
minorticks="4"
side="left"
hidefirst="0"
hidelast="0"
hideminorticks="0"
hide="0" />
</y1axis>
<!-- ================= COURBES / DONNEES ================================== -->
<data>
<rainfall_24h
axisbind="y1axis"
legend="PRECIPITATIONS SUR DUREE DE 24H00."
color1="33FFFF00"
color2="66FF0000"
antialiasing="1"
filled="1" />
<rainfall_24h
axisbind="y1axis"
legend=""
hidelegend="1"
color1="FFFF0000"
antialiasing="1"
filled="0"
thick="2"/>
</data>
<!-- ================= CADRE LEGENDE ====================================== -->
<legend
orientation="0"
margin="5"
width="250"
position-x="350"
position-y="441"
hide="0"
shadow="0">
<font
color="FFFFFFFF"
facename="Arial"
size="14"
weight="800"
italic="1" />
<border
cornerradius="000"
color="00000000"
thick="0" />
<background
color1="00000000"
color2="00000000"
gradient="1"
gradient-direction="90"/>
</legend>
<!-- ================= FOND GRAPHIQUE ===================================== -->
<graphbackground
color1="FF000000"
color2="FF000000"
gradient="1"
gradient-direction="90" />
</lineplot>
<!-- ////////////////////////////////////////////////////////////////////// -->
<!-- == PRECIPITATIONS MENSUELLES ========================================= -->
<!-- /////////////////////////////////////////////////////////////////////// -->
<bargraph
width="875"
height="180"
shadow="000"
position-x="10"
position-y="690"
margin-top="20"
margin-right="20"
margin-bottom="30"
margin-left="65">
<border
cornerradius="0"
color="FF0000FF"
thick="0" />
<background
color1="FFOOOO00"
stretch="1" />
<!-- == AXES ============================================================== -->
<!-- == GRID=0 Pas Affichage ============================================== -->
<!-- == GRID=1 Affichage ================================================== -->
<!-- == AXES X ============================================================ -->
<xaxis
color="FFFF0000"
grid="0"
autoscale="0"
min="0"
max="0">
<!-- == LABELS X ========================================================== -->
<labels
labelinterval="1"
labels=""
angle="0"
side="left"
hide="1">
<font
color="FFFFFFFF"
facename="Arial"
size="12"
weight="800"
italic="1" />
</labels>
<!-- == GRADUATIONS X ===================================================== -->
<ticks
majorticks="1"
minorticks="0"
side="bottom"
hidefirst="0"
hidelast="0"
hideminorticks="0"
hide="1" />
</xaxis>
<!-- == AXES Y ============================================================ -->
<y1axis
color="FFFF0000"
grid="0"
autoscale="1"
min="0"
max="0"
titleside="top"
titlemargin="35">
<!-- == TITRE AXE Y ======================================================= -->
<title
text="Précipitations ( $Unit[Rainfall] )"
alignement="vcenter|hcenter"
angle="0">
<font
color="FFFFFFFF"
facename="Arial"
size="14"
weight="800"
italic="1" />
</title>
<!-- == LABELS AXES Y ===================================================== -->
<labels
labelinterval="1"
angle="0"
format=".0"
side="left"
hide="0" >
<font
color="FFFFFFFF"
facename="Arial"
size="12"
weight="400"
italic="1" />
</labels>
<!-- == GRADUATIONS AXES Y ================================================ -->
<ticks
majorticks="5"
minorticks="4"
side="left"
hidefirst="0"
hidelast="0"
hideminorticks="0"
hide="0" />
</y1axis>
<!-- == DONNEES =========================================================== -->
<data>
<stats_year_totalrainfall
axisbind="y1axis"
legend="PRECIPITATIONS MENSUELLES ."
color1="33FFFF00"
color2="FFFF0000"
antialiasing="1"
filled="0" />
<stats_year_totalrainfall
axisbind="y1axis"
legend=""
hidelegend="1"
color1="FFFF0000"
color2="33FFFF00"
antialiasing="1"
filled="0" />
</data>
<!-- == LEGENDE GRAPHIQUE ================================================= -->
<legend
orientation="0"
margin="000"
width="250"
position-x="300"
position-y="671"
hide="0"
shadow="0">
<font
color="FFFFFFFF"
facename="Arial"
size="14"
weight="800"
italic="1" />
<!-- == ENCADREMENT LEGENDE =============================================== -->
<border
cornerradius="000"
color="00000000"
thick="0" />
<background
color1="00000000"
color2="00000000"
gradient="1"
gradient-direction="90"/>
</legend>
<!-- == FOND GRAPHIQUE ==================================================== -->
<graphbackground
color1="FF000000"
color2="FF000000"
gradient="1"
gradient-direction="90" />
</bargraph>
<!-- == VALEUR JANVIER ==================================================== -->
<textbox
width="060"
height="020"
shadow="0"
position-x="075"
position-y="690"
margin="00">
<text alignement="center|top">
<line text="$Stats[201501,TotalRainfall]"/>
<font
color="FFFFFFFF"
facename="Comic sans ms"
size="18"
weight="600"
italic="0" />
</text>
<background color="00000000"/>
</textbox>
<!-- == VALEUR FEVRIER ==================================================== -->
<textbox
width="060"
height="020"
shadow="0"
position-x="142"
position-y="690"
margin="00">
<text alignement="center|top">
<line text="$Stats[201502,TotalRainfall]"/>
<font
color="FFFFFFFF"
facename="Comic sans ms"
size="18"
weight="600"
italic="0" />
</text>
<background color="00000000"/>
</textbox>
<!-- == VALEUR MARS ==================================================== -->
<textbox
width="060"
height="020"
shadow="0"
position-x="207"
position-y="690"
margin="00">
<text alignement="center|top">
<line text="$Stats[201503,TotalRainfall]"/>
<font
color="FFFFFFFF"
facename="Comic sans ms"
size="18"
weight="600"
italic="0" />
</text>
<background color="00000000"/>
</textbox>
<!-- == VALEUR AVRIL ==================================================== -->
<textbox
width="060"
height="020"
shadow="0"
position-x="273"
position-y="690"
margin="00">
<text alignement="center|top">
<line text="$Stats[201504,TotalRainfall]"/>
<font
color="FFFFFFFF"
facename="Comic sans ms"
size="18"
weight="600"
italic="0" />
</text>
<background color="00000000"/>
</textbox>
<!-- == VALEUR MAI ==================================================== -->
<textbox
width="060"
height="020"
shadow="0"
position-x="338"
position-y="690"
margin="00">
<text alignement="center|top">
<line text="$Stats[201505,TotalRainfall]"/>
<font
color="FFFFFFFF"
facename="Comic sans ms"
size="18"
weight="600"
italic="0" />
</text>
<background color="00000000"/>
</textbox>
<!-- == VALEUR JUIN ==================================================== -->
<textbox
width="060"
height="020"
shadow="0"
position-x="405"
position-y="690"
margin="00">
<text alignement="center|top">
<line text="$Stats[201506,TotalRainfall]"/>
<font
color="FFFFFFFF"
facename="Comic sans ms"
size="18"
weight="600"
italic="0" />
</text>
<background color="00000000"/>
</textbox>
<!-- == VALEUR JUILLET ==================================================== -->
<textbox
width="060"
height="020"
shadow="0"
position-x="471"
position-y="690"
margin="00">
<text alignement="center|top">
<line text="$Stats[201507,TotalRainfall]"/>
<font
color="FFFFFFFF"
facename="Comic sans ms"
size="18"
weight="600"
italic="0" />
</text>
<background color="00000000"/>
</textbox>
<!-- == VALEUR AOUT ==================================================== -->
<textbox
width="060"
height="020"
shadow="0"
position-x="536"
position-y="690"
margin="00">
<text alignement="center|top">
<line text="$Stats[201508,TotalRainfall]"/>
<font
color="FFFFFFFF"
facename="Comic sans ms"
size="18"
weight="600"
italic="0" />
</text>
<background color="00000000"/>
</textbox>
<!-- == VALEUR SEPTEMBRE ==================================================== -->
<textbox
width="060"
height="020"
shadow="0"
position-x="602"
position-y="690"
margin="00">
<text alignement="center|top">
<line text="$Stats[201509,TotalRainfall]"/>
<font
color="FFFFFFFF"
facename="Comic sans ms"
size="18"
weight="600"
italic="0" />
</text>
<background color="00000000"/>
</textbox>
<!-- == VALEUR OCTOBRE ==================================================== -->
<textbox
width="060"
height="020"
shadow="0"
position-x="667"
position-y="690"
margin="00">
<text alignement="center|top">
<line text="$Stats[201510,TotalRainfall]"/>
<font
color="FFFFFFFF"
facename="Comic sans ms"
size="18"
weight="600"
italic="0" />
</text>
<background color="00000000"/>
</textbox>
<!-- == VALEUR NOVEMBRE ==================================================== -->
<textbox
width="060"
height="020"
shadow="0"
position-x="733"
position-y="690"
margin="00">
<text alignement="center|top">
<line text="$Stats[201511,TotalRainfall]"/>
<font
color="FFFFFFFF"
facename="Comic sans ms"
size="18"
weight="600"
italic="0" />
</text>
<background color="00000000"/>
</textbox>
<!-- == VALEUR DECEMBRE ==================================================== -->
<textbox
width="060"
height="020"
shadow="0"
position-x="798"
position-y="690"
margin="00">
<text alignement="center|top">
<line text="$Stats[201512,TotalRainfall]"/>
<font
color="FFFFFFFF"
facename="Comic sans ms"
size="18"
weight="600"
italic="0" />
</text>
<background color="00000000"/>
</textbox>
<!-- ///////////////////////////////////////////////////////////////////////////// -->
<!-- == GRAPHISME ================================================================ -->
<!-- ///////////////////////////////////////////////////////////////////////////// -->
<!-- == LIGNE HORIZONTALE 1 (05) ================================================= -->
<frame
width="875"
height="005"
shadow="0"
position-x="010"
position-y="005"
margin="10">
<background
color1="FF696969"
color2=""
gradient="0"
gradient-direction="90"
stretch="1" />
<border
cornerradius="0"
color="FF696969"
thick="1" />
</frame>
<!-- == LIGNE HORIZONTALE 2 (03) ================================================= -->
<frame
width="875"
height="005"
shadow="0"
position-x="010"
position-y="215"
margin="10">
<background
color1="FF696969"
color2=""
gradient="0"
gradient-direction="90"
stretch="1" />
<border
cornerradius="0"
color="FF696969"
thick="1" />
</frame>
<!-- == LIGNE HORIZONTALE 3 (03) ================================================= -->
<frame
width="875"
height="005"
shadow="0"
position-x="010"
position-y="440"
margin="10">
<background
color1="FF696969"
color2=""
gradient="0"
gradient-direction="90"
stretch="1" />
<border
cornerradius="0"
color="FF696969"
thick="1" />
</frame>
<!-- == LIGNE HORIZONTALE 4 (03) ================================================= -->
<frame
width="875"
height="005"
shadow="0"
position-x="010"
position-y="665"
margin="10">
<background
color1="FF696969"
color2=""
gradient="0"
gradient-direction="90"
stretch="1" />
<border
cornerradius="0"
color="FF696969"
thick="1" />
</frame>
<!-- == LIGNE HORIZONTALE 5 (05) ================================================= -->
<frame
width="875"
height="005"
shadow="0"
position-x="010"
position-y="870"
margin="10">
<background
color1="FF696969"
color2=""
gradient="0"
gradient-direction="90"
stretch="1" />
<border
cornerradius="0"
color="FF696969"
thick="1" />
</frame>
<!-- == LIGNE VERICALE 1 (05) ==================================================== -->
<frame
width="005"
height="870"
shadow="0"
position-x="010"
position-y="005"
margin="10">
<background
color1="FF696969"
color2=""
gradient="0"
gradient-direction="90"
stretch="1" />
<border
cornerradius="0"
color="FF696969"
thick="1" />
</frame>
<!-- == LIGNE VERICALE 2 (05) ==================================================== -->
<frame
width="005"
height="870"
shadow="0"
position-x="885"
position-y="005"
margin="10">
<background
color1="FF696969"
color2=""
gradient="0"
gradient-direction="90"
stretch="1" />
<border
cornerradius="0"
color="FF696969"
thick="1" />
</frame>
<!-- == LIGNE VERICALE BARGRAPH FEVRIER (02) ===================================== -->
<frame
width="002"
height="150"
shadow="0"
position-x="140"
position-y="690"
margin="10">
<background
color1="FF696969"
color2=""
gradient="0"
gradient-direction="90"
stretch="1" />
<border
cornerradius="0"
color="FF696969"
thick="1" />
</frame>
<!-- == LIGNE VERICALE BARGRAPH MARS (02) ======================================== -->
<frame
width="002"
height="150"
shadow="0"
position-x="205"
position-y="690"
margin="10">
<background
color1="FF696969"
color2=""
gradient="0"
gradient-direction="90"
stretch="1" />
<border
cornerradius="0"
color="FF696969"
thick="1" />
</frame>
<!-- == LIGNE VERICALE BARGRAPH AVRIL (02) ======================================= -->
<frame
width="002"
height="150"
shadow="0"
position-x="271"
position-y="690"
margin="10">
<background
color1="FF696969"
color2=""
gradient="0"
gradient-direction="90"
stretch="1" />
<border
cornerradius="0"
color="FF696969"
thick="1" />
</frame>
<!-- == LIGNE VERICALE BARGRAPH MAI (02) ========================================= -->
<frame
width="002"
height="150"
shadow="0"
position-x="337"
position-y="690"
margin="10">
<background
color1="FF696969"
color2=""
gradient="0"
gradient-direction="90"
stretch="1" />
<border
cornerradius="0"
color="FF696969"
thick="1" />
</frame>
<!-- == LIGNE VERICALE BARGRAPH JUILLET (02) ===================================== -->
<frame
width="002"
height="150"
shadow="0"
position-x="403"
position-y="690"
margin="10">
<background
color1="FF696969"
color2=""
gradient="0"
gradient-direction="90"
stretch="1" />
<border
cornerradius="0"
color="FF696969"
thick="1" />
</frame>
<!-- == LIGNE VERICALE BARGRAPH JUILLET (02) ===================================== -->
<frame
width="002"
height="150"
shadow="0"
position-x="469"
position-y="690"
margin="10">
<background
color1="FF696969"
color2=""
gradient="0"
gradient-direction="90"
stretch="1" />
<border
cornerradius="0"
color="FF696969"
thick="1" />
</frame>
<!-- == LIGNE VERICALE BARGRAPH AOUT (02) ======================================== -->
<frame
width="002"
height="150"
shadow="0"
position-x="535"
position-y="690"
margin="10">
<background
color1="FF696969"
color2=""
gradient="0"
gradient-direction="90"
stretch="1" />
<border
cornerradius="0"
color="FF696969"
thick="1" />
</frame>
<!-- == LIGNE VERICALE BARGRAPH SEPTEMBRE (02) =================================== -->
<frame
width="002"
height="150"
shadow="0"
position-x="601"
position-y="690"
margin="10">
<background
color1="FF696969"
color2=""
gradient="0"
gradient-direction="90"
stretch="1" />
<border
cornerradius="0"
color="FF696969"
thick="1" />
</frame>
<!-- == LIGNE VERICALE BARGRAPH OCTOBRE (02) ===================================== -->
<frame
width="002"
height="150"
shadow="0"
position-x="667"
position-y="690"
margin="10">
<background
color1="FF696969"
color2=""
gradient="0"
gradient-direction="90"
stretch="1" />
<border
cornerradius="0"
color="FF696969"
thick="1" />
</frame>
<!-- == LIGNE VERICALE BARGRAPH NOVEMBRE (02) ==================================== -->
<frame
width="002"
height="150"
shadow="0"
position-x="732"
position-y="690"
margin="10">
<background
color1="FF696969"
color2=""
gradient="0"
gradient-direction="90"
stretch="1" />
<border
cornerradius="0"
color="FF696969"
thick="1" />
</frame>
<!-- == LIGNE VERICALE BARGRAPH DECEMBRE (02) ==================================== -->
<frame
width="002"
height="150"
shadow="0"
position-x="797"
position-y="690"
margin="10">
<background
color1="FF696969"
color2=""
gradient="0"
gradient-direction="90"
stretch="1" />
<border
cornerradius="0"
color="FF696969"
thick="1" />
</frame>
<!-- == PRECIPITATIONS ANNUELLES ===================================================== -->
<textbox
width="220"
height="020"
shadow="0"
position-x="650"
position-y="670"
margin="00">
<text alignement="center|top">
<line text="CUMUL ANNUEL : $Stats[Year,TotalRainfall] (mm)"/>
<font
color="FFFF0000"
facename="Comic sans ms"
size="18"
weight="600"
italic="0" />
</text>
<background color="00000000"/>
</textbox>
<!-- ///////////////////////////////////////////////////////////////////////////// -->
<!-- == AFFICHAGE DES MOIS ======================================================= -->
<!-- ///////////////////////////////////////////////////////////////////////////// -->
<textbox
width="800"
height="020"
shadow="1"
position-x="075"
position-y="845"
margin="000">
<background
color1="000000FF" />
<text
alignement="left|top">
<line text=" JANVIER FEVRIER MARS AVRIL MAI JUIN JUILLET AOUT SEPTEMBRE OCTOBRE NOVEMBRE DECEMBRE" />
<font
facename="Arial"
color="FFFFFFFF"
size="12"
weight="800"
italic="0" />
</text>
</textbox>
<!-- == COPYRIGHT ============================================================= -->
<textbox
width="300"
height="017"
shadow="0"
position-x="585"
position-y="860"
margin="00">
<text alignement="center|top">
<line text="© GROGNON 2012 VIRUSDUNIL 2015"/>
<font
color="FFFF9900"
facename="Comic sans ms"
size="16"
weight="800"
italic="0" />
</text>
<border
cornerradius="005"
color="FF696969"
thick="001" />
<background color="FF000000"/>
</textbox>
</stylesheet>