Depuis quelque temps j'ai une station météo et j'utilise GraphWeather.
Grâce aux tutos trouvé sur le site de "Météo Villarzel" (merci à l'auteur) je commence à comprendre comment cela fonctionne.
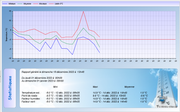
Mais là je bloque : je souhaite faire un graphique mensuel avec une courbe qui montre la tempérarute max, min et moyenne par jour.
Je suis parti du fichier qui donne les stats par mois "graph-month-1.xml" qui est sous forme de barre que j'ai modifié en courbe.
Le souci c'est que j'ai bien les courbes qui s'affichent par contre sur l'axe des x, je n'ai pas les jours qui apparaissent mais uniquement le chiffre 01 !
Ci-dessous ce que j’obtiens :
Ci-dessous le code du graphique :
<?xml version="1.0" encoding="iso-8859-1" ?>
<stylesheet>
<image width="900" height="560" />
<frame width="900" height="560" position-x="0" position-y="0" shadow="0">
<title text="" alignement="horizontal" angle="0">
<font color="FF000000" facename="Arial" size="14" weight="400" italic="0" />
</title>
<background color1="FF6699CC" color2="FFFFFFFF" gradient="1" gradient-direction="135" stretch="1" />
<border cornerradius="0" color="55555555" thick="1" />
</frame>
<!-- ================= First Lineplot ================= -->
<lineplot width="890" height="320" shadow="0" position-x="10" position-y="10" margin-top="40" margin-right="20" margin-bottom="40" margin-left="45">
<xaxis color="FF000000" grid="1" autoscale="1" min="0" max="0">
<labels labelinterval="1" angle="0" side="left" hide="0" format="%d">
<font color="FF000000" facename="Arial" size="12" weight="400" italic="1" />
</labels>
<ticks majorticks="7" minorticks="4" side="bottom" hidefirst="0" hidelast="0" hideminorticks="0" hide="0" />
</xaxis>
<y1axis color="FF000000" grid="1" autoscale="1" min="0" max="0" y-base="0.0" titleside="left" titlemargin="25">
<title text="Temperature ($UNIT[TEMPERATURE])" alignement="vcenter|hcenter" angle="0">
<font color="FF000000" facename="Arial" size="12" weight="400" italic="1" />
</title>
<labels labelinterval="1" angle="0" format=".0" side="left" hide="0" >
<font color="FF000000" facename="Arial" size="12" weight="400" italic="1" />
</labels>
<ticks majorticks="5" minorticks="4" side="left" hidefirst="0" hidelast="0" hideminorticks="0" hide="0" />
</y1axis>
<data>
<stats_month_min_outdoor_temperature axisbind="y1axis" legend="Minimum" color1="FF0000FF" antialiasing="1" filled="0" hide="0" thick="1.2" />
<stats_month_truemean_outdoor_temperature axisbind="y1axis" legend="Moyenne" color1="FF009933" antialiasing="1" filled="0" />
<stats_month_max_outdoor_temperature axisbind="y1axis" legend="Maximum" color1="FFFF0000" antialiasing="1" filled="0" />
<threshold axisbind="y1axis" legend="Limite 0°C" color1="FFFF0000" value="0" thick="1.0"/>
</data>
<legend orientation="0" margin="3" width="900" position-x="0" position-y="0" hide="0" shadow="0">
<font color="FF000000" facename="Arial" size="12" weight="400" italic="1" />
<border cornerradius="0" color="55555555" thick="1" />
<background color1="FFBBBBFF" color2="FFFFFFFF" gradient="1" gradient-direction="90"/>
</legend>
<graphbackground color1="FFCCCCFF" color2="FFFFFFFF" gradient="1" gradient-direction="90" />
</lineplot>
<!-- ================= Statistics ================= -->
<textbox width="800" height="200" shadow="0" position-x="90" position-y="340" margin="10" >
<border cornerradius="10" color="55555555" thick="1" />
<text alignement="left|top">
<line text="Rapport généré le $CurrentDate[%A %d %B %Y à %Hh%M]\n"/>
<line text="Du $StartDate[%A %d %B %Y à %Hh%M]"/>
<line text="Au $StopDate[%A %d %B %Y à %Hh%M]"/>
<line text=""/>
<line text="\t\t\t\tMini\t\t\t\t\tMaxi\t\t\t\tMoyenne"/>
<line text=""/>
<line text="Température ext. :\t $Min[outdoor_temperature] $Unit[Temperature] - $MinDate[outdoor_temperature,%d %b %Y à %Hh%M]\t\t$Max[outdoor_temperature] $Unit[Temperature] - $MaxDate[outdoor_temperature,%d %b %Y à %Hh%M]\t\t$Mean[outdoor_temperature] $Unit[Temperature]"/>
<line text="Point de rosée :\t $Min[dew_point] $Unit[Temperature] - $MinDate[dew_point,%d %b %Y à %Hh%M]\t\t$Max[dew_point] $Unit[Temperature] - $MaxDate[dew_point,%d %b %Y à %Hh%M]\t\t$Mean[dew_point] $Unit[Temperature]"/>
<line text="Facteur humidex :\t $Min[heat_index] $Unit[Temperature] - $MinDate[heat_index,%d %b %Y à %Hh%M]\t\t$Max[heat_index] $Unit[Temperature] - $MaxDate[heat_index,%d %b %Y à %Hh%M]\t\t$Mean[heat_index] $Unit[Temperature]"/>
<line text="Facteur vent :\t\t $Min[wind_chill] $Unit[Temperature] - $MinDate[wind_chill,%d %b %Y à %Hh%M]\t\t$Max[wind_chill] $Unit[Temperature] - $MaxDate[wind_chill,%d %b %Y à %Hh%M]\t\t$Mean[wind_chill] $Unit[Temperature]"/>
<font color="FF000000" facename="Arial" size="15" weight="400" italic="1" />
</text>
<background color="00000000" texture="temperature.png" stretch="1" />
</textbox>
<textbox width="62" height="200" shadow="0" position-x="10" position-y="340" margin="0" >
<border cornerradius="10" color="55555555" thick="1" />
<background color1="FFBBBBFF" color2="FFFFFFFF" gradient="1" gradient-direction="180" />
</textbox>
<textbox width="180" height="20" shadow="0" position-x="-50" position-y="430" margin="0" >
<text alignement="center" angle="90">
<line text="Statistiques" alignement="center" />
<font color="FF0066CC" facename="Comic sans ms" size="28" weight="600" italic="0" />
</text>
</textbox>
<!-- =================Source================= -->
<textbox width="150" height="20" shadow="0" position-x="110" position-y="520" margin="0" >
<text alignement="left">
<line text=""/>
<font color="FF000000" size="16" weight="20" italic="0" />
</text>
</textbox>
</stylesheet>
D'avance merci pour l'aide