Bonjour,
Je viens d'installer GW et essaie tant bien que mal de sortir des graphs... en fouillant sur le forum j'ai pu trouver des mises en page mais voila quand le les copie le résultats est très différents de ce que ça devrait être...

tout se monte l'un sur l'autre certains caractères sont remplacés par des pâtés....
Est ce que quelqu'un aurait une solution ?
merci d'avance
Matthieu
PS : code utilisé :
<?xml version="1.0" encoding="iso-8859-1"?>
<stylesheet>
<image width="1200" height="950" />
<!-- ================= Background ================= -->
<frame width="1200" height="800" position-x="0" position-y="0">
<background color1="FFFFCC66" color2="FFFFCC99" gradient="1" gradient-direction="90" stretch="1" />
<border cornerradius="0" color="FF555555" thick="1" />
</frame>
<!-- ================= Stats ================= -->
<textbox width="350" height="350" shadow="1" position-x="10" position-y="20" margin="10">
<background color1="FFFFCCCC" color2="FFFFFFFF" gradient="1" gradient-direction="90" stretch="1" />
<border cornerradius="10" color="FF999999" thick="1" />
<text alignement="center">
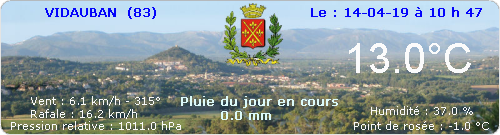
<line text="$Country le $CurrentDate[%A %d %B %Y à %Hh%M]" />
<line text="" />
<line text="Pression relative : $Current[relative_pressure] $Unit[Pressure] ($Current[rate_relative_pressure] $Unit[Pressure]/h)" />
<line text="Humidité exterieure : $Current[outdoor_humidity] %" />
<line text="Point de rosée : $Current[dew_point] $Unit[Temperature]" />
<line text="Wind Chill : $Current[wind_chill] $Unit[Temperature]" />
<line text="Facteur humidex : $Current[heat_index] $Unit[Temperature]" />
<line text="Rafales : $CURRENT[wind_gust] $UNIT[SPEED]" />
<line text="Moyenne Vent : $CURRENT[wind_speed] $UNIT[SPEED]" />
<line text="Pluie 1h : $Current[rainfall_1h] $Unit[Rainfall]" />
<line text="Précipitations du mois : $Stats[Month,TotalRainfall] $Unit[Rainfall]" />
<line text="Précipitations de l'année : $Stats[Year,TotalRainfall] $Unit[Rainfall]" />
<line text="Indice UV : $Current[uv_index] $UNIT[u/v]" />
<line text="" />
<line text="Prévision à 12h : $WeatherForecast[Comment]" />
<font color="FF000000" size="20" weight="800" italic="0" />
</text>
</textbox>
<textbox width="200" height="65" shadow="1" position-x="400" position-y="20" margin="10">
<background color1="FFAABAFF" color2="FFFFFFFF" gradient="1" gradient-direction="45" stretch="1" />
<border cornerradius="10" color="FF999999" thick="1" />
<text alignement="4">
<line text="$Current[outdoor_temperature] $Unit[Temperature]" />
<font color="FFFF0000" size="40" weight="800" italic="0" />
</text>
<background color="00000000" />
</textbox>
<circulargauge width="150" height="150" shadow="0" orientation="1" position-x="700" position-y="20" margin-top="0" margin-right="0" margin-bottom="0" margin-left="0">
<axis color="FF000000" min="0" max="360" titlemargin="20" titleside="32" fromangle="90" toangle="450">
<labels labels="NORD;NORD OUEST;OUEST;SUD OUEST;SUD;SUD EST;EST;NORD EST" labelinterval="1" side="1" hide="0">
<font color="FF009999" facename="Comic sans ms" s0ze="20" weight="800" italic="0" />
</labels>
<ticks majorticks="9" minorticks="3" side="32" hidefirst="0" hidelast="0" hideminorticks="0" hide="0" minorticksize="5" majorticksize="9"/>
</axis>
<index>
<current_wind_direction color1="99FF0200" />
</index>
<border cornerradius="0" color="FF000000" thick="0" />
<gaugebackground color="00000000" texture="" />
</circulargauge>
<!-- ================= First Lineplot ================= -->
<lineplot width="250" height="120" shadow="0" position-x="410" position-y="125" margin-top="10" margin-right="0" margin-bottom="0" margin-left="0">
<xaxis color="FF000000" grid="1" autoscale="0" min="0" max="0">
<title text="" alignement="vcenter|hcenter" angle="0">
<font color="FF000000" facename="Arial" size="12" weight="400" italic="1" />
</title>
<labels labelinterval="1" angle="0" side="left" hide="0">
<font color="FF000000" facename="Arial" size="15" weight="400" italic="1" />
</labels>
<ticks majorticks="7" minorticks="4" side="bottom" hidefirst="0" hidelast="0" hideminorticks="0" hide="0" />
</xaxis>
<y1axis color="FF000000" grid="1" autoscale="1" min="0" max="0" titleside="top" titlemargin="35">
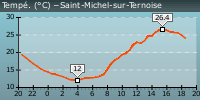
<title text="Température ($Unit[Temperature])" alignement="vcenter|hcenter" angle="0">
<font color="FF000000" facename="Arial" size="16" weight="400" italic="1" />
</title>
<labels labelinterval="1" angle="0" format=".0" side="left" hide="0" >
<font color="FF000000" facename="Arial" size="16" weight="400" italic="1" />
</labels>
<ticks majorticks="4" minorticks="4" side="left" hidefirst="0" hidelast="0" hideminorticks="0" hide="0" />
</y1axis>
<data>
<outdoor_temperature axisbind="y1axis" legend="Température ext." color1="FFFF0000" antialiasing="1" filled="0" hide="0" thick="1.2"/>
</data>
<legend orientation="0" margin="5" width="250" position-x="410" position-y="100" hide="0" shadow="0">
<font color="FF000000" facename="Arial" size="16" weight="400" italic="1" />
<border cornerradius="0" color="55555555" thick="0" />
</legend>
<border cornerradius="0" color="55555555" thick="0" />
<background color1="00000000" stretch="1" />
<graphbackground color1="FFCCCCFF" color2="FFFFFFFF" gradient="1" gradient-direction="90" />
</lineplot>
<!-- ================= Second Lineplot ================= -->
<lineplot width="320" height="250" shadow="0" position-x="80" position-y="420" margin-top="0" margin-right="0" margin-bottom="0" margin-left="0">
<xaxis color="FF000000" grid="1" autoscale="0" min="0" max="0">
<title text="" alignement="20" angle="0">
<font color="FF000000" facename="Arial" size="12" weight="400" italic="1" />
</title>
<labels labelinterval="1" angle="0" side="2" hide="0">
<font color="FF000000" facename="Arial" size="12" weight="400" italic="1" />
</labels>
<ticks majorticks="7" minorticks="4" side="32" hidefirst="0" hidelast="0" hideminorticks="0" hide="0" />
</xaxis>
<y1axis color="FF000000" grid="1" autoscale="0" min="0" max="360" titleside="1" titlemargin="25">
<title text="Direction du vent (°)" alignement="20" angle="0">
<font color="FF000000" facename="Arial" size="12" weight="400" italic="1" />
</title>
<labels labelinterval="1" angle="0" format=".1" side="2" hide="0" >
<font color="FF000000" facename="Arial" size="12" weight="400" italic="1" />
</labels>
<ticks majorticks="5" minorticks="4" side="2" hidefirst="0" hidelast="0" hideminorticks="0" hide="0" />
</y1axis>
<y2axis color="FF000000" grid="1" autoscale="1" min="0" max="0" titleside="1" titlemargin="35">
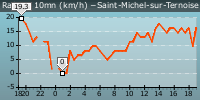
<title text="Vitesse du vent ($UNIT[SPEED])" alignement="20" angle="0">
<font color="FF000000" facename="Arial" size="12" weight="400" italic="1" />
</title>
<labels labelinterval="1" angle="0" format=".1" side="2" hide="0" >
<font color="FF000000" facename="Arial" size="12" weight="400" italic="1" />
</labels>
<ticks majorticks="5" minorticks="4" side="2" hidefirst="0" hidelast="0" hideminorticks="0" hide="0" />
</y2axis>
<y3axis side="8" color="FF000000" grid="0" autoscale="1" min="0" max="0" titleside="8" titlemargin="40">
<title text="Précipitations relative et 1h ($UNIT[RAINFALL])" alignement="20" angle="0">
<font color="FF000000" facename="Arial" size="12" weight="400" italic="1" />
</title>
<labels labelinterval="1" angle="0" format=".1" side="8" hide="0" >
<font color="FF000000" facename="Arial" size="12" weight="400" italic="1" />
</labels>
<ticks majorticks="5" minorticks="4" side="2" hidefirst="0" hidelast="0" hideminorticks="0" hide="0" />
</y3axis>
<y4axis side="8" color="FF000000" grid="0" autoscale="1" min="0" max="0" titleside="8" titlemargin="40" ydelta="65">
<title text="Précipitations 24h ($UNIT[RAINFALL])" alignement="20" angle="0">
<font color="FF000000" facename="Arial" size="12" weight="400" italic="1" />
</title>
<labels labelinterval="1" angle="0" format=".1" side="8" hide="0">
<font color="FF000000" facename="Arial" size="12" weight="400" italic="1" />
</labels>
<ticks majorticks="5" minorticks="4" side="8" hidefirst="0" hidelast="0" hideminorticks="0" hide="0" />
</y4axis>
<data>
<wind_speed axisbind="y2axis" legend="Vitesse du vent" color1="66FF0000" color2="33FF0000" antialiasing="1" filled="1" />
<wind_speed axisbind="y2axis" legend="Vitesse du vent" color1="66FF0000" antialiasing="1" filled="0" hidelegend="1" thick="1.2"/>
<wind_gust axisbind="y2axis" legend="Rafales" color1="FFFF0000" antialiasing="1" filled="0" hidelegend="0" thick="1.2"/>
<wind_direction axisbind="y1axis" legend="Direction du vent" color1="FFFF0000" antialiasing="1" filled="0" hidelegend="0" thick="3" pattern="00000000"/>
<relative_rainfall axisbind="y3axis" legend="Précipitations" color1="660000FF" color2="330000FF" antialiasing="1" filled="1" />
<relative_rainfall axisbind="y3axis" legend="Précipitations" color1="660000FF" antialiasing="1" filled="0" hidelegend="1" thick="1.2" />
<rainfall_1h axisbind="y3axis" legend="Précipitations 1h" color1="FFFF0000" antialiasing="1" filled="0" hidelegend="0" thick="1.2"/>
<rainfall_24h axisbind="y4axis" legend="Précipitations 24h" color1="FF009000" antialiasing="1" filled="0" hidelegend="0" thick="1.2"/>
</data>
<legend orientation="0" margin="5" width="800" position-x="100" position-y="700" hide="0" shadow="0">
<font color="FF000000" facename="Arial" size="15" weight="400" italic="1" />
<border cornerradius="0" color="55555555" thick="1" />
<background color1="FFBBBBFF" color2="FFFFFFFF" gradient="1" gradient-direction="90" />
</legend>
<border cornerradius="0" color="55555555" thick="0" />
<graphbackground color1="FFCCCCFF" color2="FFFFFFFF" gradient="1" gradient-direction="90" />
</lineplot>
<!-- ================= First Lineplot ================= -->
<lineplot width="320" height="250" shadow="0" position-x="580" position-y="420" margin-top="0" margin-right="0" margin-bottom="0" margin-left="0">
<xaxis color="FF000000" grid="1" autoscale="0" min="0" max="0">
<title text="" alignement="20" angle="0">
<font color="FF000000" facename="Arial" size="12" weight="400" italic="1" />
</title>
<labels labelinterval="1" angle="0" side="2" hide="0">
<font color="FF000000" facename="Arial" size="12" weight="400" italic="1" />
</labels>
<ticks majorticks="7" minorticks="4" side="32" hidefirst="0" hidelast="0" hideminorticks="0" hide="0" />
</xaxis>
<y1axis color="FF000000" grid="1" autoscale="1" min="0" max="0" titleside="1" titlemargin="25">
<title text="Température ($UNIT[TEMPERATURE])" alignement="20" angle="0">
<font color="FF000000" facename="Arial" size="12" weight="400" italic="1" />
</title>
<labels labelinterval="1" angle="0" format=".0" side="2" hide="0" >
<font color="FF000000" facename="Arial" size="12" weight="400" italic="1" />
</labels>
<ticks majorticks="5" minorticks="4" side="2" hidefirst="0" hidelast="0" hideminorticks="0" hide="0" />
</y1axis>
<y2axis side="8" color="FF000000" grid="0" autoscale="1" min="0" max="0" titleside="8" titlemargin="40">
<title text="Pression ($UNIT[PRESSURE])" alignement="20" angle="0">
<font color="FF000000" facename="Arial" size="12" weight="400" italic="1" />
</title>
<labels labelinterval="1" angle="0" format=".1" side="8" hide="0">
<font color="FF000000" facename="Arial" size="12" weight="400" italic="1" />
</labels>
<ticks majorticks="5" minorticks="4" side="8" hidefirst="0" hidelast="0" hideminorticks="0" hide="0" />
</y2axis>
<y3axis side="8" color="FF000000" grid="0" autoscale="0" min="0" max="100" titleside="8" ydelta="65" titlemargin="40">
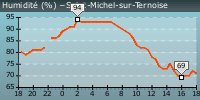
<title text="Humidité (%)" alignement="20" angle="0">
<font color="FF000000" facename="Arial" size="12" weight="400" italic="1" />
</title>
<labels labelinterval="1" angle="0" format=".1" side="8" hide="0">
<font color="FF000000" facename="Arial" size="12" weight="400" italic="1" />
</labels>
<ticks majorticks="5" minorticks="4" side="8" hidefirst="0" hidelast="0" hideminorticks="0" hide="0" />
</y3axis>
<y4axis color="FF000000" grid="1" autoscale="0" min="0" max="12" titleside="1" titlemargin="35">
<title text="Indice UV" alignement="20" angle="0">
<font color="FF000000" facename="Arial" size="12" weight="400" italic="1" />
</title>
<labels labelinterval="1" angle="0" format=".1" side="2" hide="0" >
<font color="FF000000" facename="Arial" size="12" weight="400" italic="1" />
</labels>
<ticks majorticks="5" minorticks="2" side="2" hidefirst="0" hidelast="0" hideminorticks="0" hide="0" />
</y4axis>
<data>
<outdoor_humidity axisbind="y3axis" legend="Humidité ext." color1="3000FF00" color2="300000FF" antialiasing="1" filled="1" hide="0" />
<outdoor_humidity axisbind="y3axis" legend="Humidité ext." color1="300000FF" antialiasing="1" hidelegend="1" thick="1.2"/>
<wind_chill axisbind="y1axis" legend="Facteur vent" color1="FF0000FF" antialiasing="1" filled="0" hide="0" thick="1.2" pattern="CCCCCCCC"/>
<heat_index axisbind="y1axis" legend="Humidex" color1="FFFF0000" antialiasing="1" filled="0" hide="0" thick="1.2" pattern="CCCCCCCC"/>
<outdoor_temperature axisbind="y1axis" legend="Température ext." color1="FFFF0000" antialiasing="1" filled="0" hide="0" thick="1.2"/>
<dew_point axisbind="y1axis" legend="Point de rosée" color1="FF0000FF" antialiasing="1" filled="0" hide="0" thick="1.2"/>
<relative_pressure axisbind="y2axis" legend="Pression rel." color1="FF009000" antialiasing="1" filled="0" hide="0" thick="1.2"/>
<uv_index axisbind="y4axis" legend="Indice UV" color1="44FFFF00" color2="44FF0000" antialiasing="1" filled="1" hide="0" thick="1.2"/>
</data>
<legend orientation="0" width="800" margin="5" position-x="100" position-y="375" hide="0" shadow="0">
<font color="FF000000" facename="Arial" size="15" weight="400" italic="1" />
<border cornerradius="0" color="55555555" thick="1" />
<background color1="FFBBBBFF" color2="FFFFFFFF" gradient="1" gradient-direction="90" />
</legend>
<background color="00FFFFFF" stretch="0" />
<graphbackground color1="FFCCCCFF" color2="FFFFFFFF" gradient="1" gradient-direction="90" />
<border cornerradius="0" color="FF000000" thick="0" />
</lineplot>
<!-- ================= Statistics ================= -->
<textbox width="200" height="50" shadow="0" position-x="700" position-y="200" margin="0" >
<text alignement="left|top">
<line text="Température Min: $Min[outdoor_temperature] $Unit[Temperature] $MinDate[outdoor_temperature, à %Hh%M]"/>
<line text="Température Max: $Max[outdoor_temperature] $Unit[Temperature] $MaxDate[outdoor_temperature, à %Hh%M]"/>
</text>
</textbox>
<!-- ================= Radarplot ================= -->
<radarplot width="130" height="130" shadow="0" position-x="880" position-y="78" margin-top="0" margin-right="0" margin-bottom="0" margin-left="0" >
<title text="Vents dominants" alignement="vcenter|hcenter" angle="0">
<font color="FF000000" facename="Arial" size="16" weight="400" italic="0" />
</title>
<border cornerradius="0" color="FF000000" thick="0" />
<axis color="50000000" grid="1" autoscale="1" min="0" max="0">
<labels labelinterval="1" angle="0" format=".0" side="left" hide="0">
<font color="FF000000" facename="Arial" size="14" weight="400" italic="0" />
</labels>
<ticks majorticks="4" minorticks="2" side="bottom" hidefirst="1" hideminorticks="0" hide="0" />
<titles text="E;ENE;NE;NNE;N;NN0;N0;0N0;0;0S0;S0;SS0;S;SSE;SE;ESE">
<font color="FF000000" facename="Arial" size="14" weight="400" italic="0" />
</titles>
</axis>
<legend position-x="0" position-y="0" hide="1" shadow="0">
<font color="FF000000" facename="Arial" size="14" weight="400" italic="0" />
<border cornerradius="0" color="FF000000" thick="1" />
<background color="FFFFFFFF" texture="" />
</legend>
<background color="00000000" stretch="0" />
<graphbackground color="00000000" />
<data>
<wind_direction legend="Direction du vent" color1="600000FF" color2="40FF0000" antialiasing="1" filled="1" hide="0" />
<wind_direction legend="Direction du vent" color1="60FF0000" antialiasing="1" filled="0" hide="0" thick="1.2" />
</data>
</radarplot>
<!-- ================= First Bargraph ================= -->
<bargraph width="600" height="100" shadow="0" position-x="370" position-y="285" margin-top="0" margin-right="20" margin-bottom="30" margin-left="40">
<xaxis color="FF000000" grid="1" autoscale="1" min="0" max="0">
<labels labelinterval="1" angle="0" side="left" hide="0" format="%Y">
<font color="FF000000" facename="Arial" size="12" weight="400" italic="1" />
</labels>
<ticks majorticks="7" minorticks="4" side="bottom" hidefirst="0" hidelast="0" hideminorticks="0" hide="0" />
</xaxis>
<y1axis color="FF000000" grid="1" autoscale="0" min="-7" max="28" y-base="0.0" titleside="left" titlemargin="25">
<title text="Temperature (°)" alignement="vcenter|hcenter" angle="0">
<font color="FF000000" facename="Arial" size="12" weight="400" italic="1" />
</title>
<labels labelinterval="1" angle="0" format=".0" side="left" hide="0" >
<font color="FF000000" facename="Arial" size="12" weight="400" italic="1" />
</labels>
<ticks majorticks="6" minorticks="1" side="left" hidefirst="0" hidelast="0" hideminorticks="0" hide="0" />
</y1axis>
<data>
<stats_month_max_outdoor_temperature axisbind="y1axis" legend="Maximum" color1="FFFF0000" color2="FFAAAAAA" gradient="horizontal" antialiasing="1" filled="1" />
</data>
<legend orientation="0" margin="3" width="280" position-x="720" position-y="250" hide="0" shadow="0">
<font color="FF000000" facename="Arial" size="12" weight="400" italic="1" />
<border cornerradius="0" color="55555555" thick="1" />
<background color1="FFBBBBFF" color2="FFFFFFFF" gradient="1" gradient-direction="90"/>
</legend>
<graphbackground color1="FFCCCCFF" color2="FFFFFFFF" gradient="1" gradient-direction="90" />
</bargraph>
<!-- ================= Second Bargraph ================= -->
<bargraph width="600" height="100" shadow="0" position-x="370" position-y="285" margin-top="0" margin-right="20" margin-bottom="30" margin-left="40">
<xaxis color="FF000000" grid="0" autoscale="1" min="0" max="0">
<labels labelinterval="1" angle="0" side="left" hide="1" format="%Y">
<font color="FF000000" facename="Arial" size="12" weight="400" italic="1" />
</labels>
<ticks majorticks="7" minorticks="4" side="bottom" hidefirst="0" hidelast="0" hideminorticks="0" hide="1" />
</xaxis>
<y1axis color="FF000000" grid="0" autoscale="0" min="-7" max="28" y-base="0.0" titleside="left" titlemargin="25">
<labels labelinterval="1" angle="0" format=".0" side="left" hide="1" >
<font color="FF000000" facename="Arial" size="12" weight="400" italic="1" />
</labels>
<ticks majorticks="6" minorticks="1" side="left" hidefirst="0" hidelast="0" hideminorticks="0" hide="1" />
</y1axis>
<data>
<stats_month_truemean_outdoor_temperature axisbind="y1axis" legend="Moyenne" color1="FFFFF000" color2="FFDDAA00" gradient="horizontal" antialiasing="1" filled="1" />
</data>
<legend orientation="0" margin="3" width="280" position-x="810" position-y="250" hide="0" shadow="0">
<font color="FF000000" facename="Arial" size="12" weight="400" italic="1" />
</legend>
</bargraph>
<!-- ================= Third Bargraph ================= -->
<bargraph width="600" height="100" shadow="0" position-x="370" position-y="285" margin-top="0" margin-right="20" margin-bottom="30" margin-left="40">
<xaxis color="FF000000" grid="0" autoscale="1" min="0" max="0">
<labels labelinterval="1" angle="0" side="left" hide="1" format="%Y">
<font color="FF000000" facename="Arial" size="12" weight="400" italic="1" />
</labels>
<ticks majorticks="7" minorticks="4" side="bottom" hidefirst="0" hidelast="0" hideminorticks="0" hide="1" />
</xaxis>
<y1axis color="FF000000" grid="0" autoscale="0" min="-7" max="28" y-base="0.0" titleside="left" titlemargin="25">
<labels labelinterval="1" angle="0" format=".0" side="left" hide="1" >
<font color="FF000000" facename="Arial" size="12" weight="400" italic="1" />
</labels>
<ticks majorticks="6" minorticks="1" side="left" hidefirst="0" hidelast="0" hideminorticks="0" hide="1" />
</y1axis>
<data>
<stats_month_min_outdoor_temperature axisbind="y1axis" legend="Minimum" color1="FF0000FF" color2="FF10AADD" gradient="horizontal" antialiasing="1" filled="1" />
</data>
<legend orientation="0" margin="3" width="280" position-x="900" position-y="250" hide="0" shadow="0">
<font color="FF000000" facename="Arial" size="12" weight="400" italic="1" />
</legend>
</bargraph>
<!-- ================= Textbox ================= -->
<textbox width="80" height="30" shadow="0" position-x="630" position-y="00" margin="4" >
<text alignement="center|top">
<line text="$StartDate[%m / %Y]"/>
</text>
</textbox>
<!-- ================= Statistics ================= -->
<textbox width="300" height="50" shadow="0" position-x="60" position-y="735" margin="20" >
<border cornerradius="0" color="55555555" thick="1" />
<text alignement="left|top">
<line text="Rafale maximale : $Max[wind_gust] $Unit[Speed]\t\t$MaxDate[wind_gust,%d %b %Y à %Hh%M]"/>
<line text=""/>
<font color="FF000000" facename="Arial" size="12" weight="200" italic="1" />
</text>
<background color1="FFBBBBFF" color2="FFFFFFFF" gradient="1" gradient-direction="90" />
</textbox>
<textbox width="300" height="50" shadow="0" position-x="375" position-y="735" margin="20" >
<border cornerradius="0" color="55555555" thick="1" />
<text alignement="left|top">
<line text="Plus fort indice UV : $Max[uv_index] \t\t$MaxDate[uv_index,%d %b %Y à %Hh%M]"/>
<line text=""/>
<font color="FF000000" facename="Arial" size="12" weight="200" italic="1" />
</text>
<background color1="FFBBBBFF" color2="FFFFFFFF" gradient="1" gradient-direction="90" />
</textbox>
<textbox width="300" height="50" shadow="0" position-x="685" position-y="735" margin="20" >
<border cornerradius="0" color="55555555" thick="1" />
<text alignement="left|top">
<line text="Moyenne max : $Max[wind_speed] $Unit[Speed] \t\t$MaxDate[wind_speed,%d %b %Y à %Hh%M]"/>
<line text=""/>
<font color="FF000000" facename="Arial" size="12" weight="200" italic="1" />
</text>
<background color1="FFBBBBFF" color2="FFFFFFFF" gradient="1" gradient-direction="90" />
</textbox>
<!-- ================= Icon ================= -->
<frame width="72" height="72" position-x="915" position-y="0">
<background color="ff0000ff" texture="$WeatherConditions[Icon]" stretch="1" />
</frame>
<frame width="70" height="70" position-x="290" position-y="300">
<background color="ff0000ff" texture="$WeatherForecast[Icon]" stretch="1" />
</frame>
</stylesheet>